Generating a Cross-Sectional Dataset
This example involves generating a dataset to analyze health satisfaction determinants in 2008, and you can either use the Paneldata.org syntax generator or write your own syntax file to perform this task. You can search for the variable names in Paneldata.org (or use the variables below directly).
1. Generate a cross-sectional dataset for the year 2008, which should contain all persons with the following characteristics:
The dataset should contain the following variables of interest.
satisfaction with health "yp0101"
smoking currently yes/no "yp10601"
current employment status "emplst08"
monthly household net income "hinc08"
In addition, the dataset should contain the following additional information for a 2008 cross-sectional analysis (these variables are automatically generated by paneldata.org):
current cross-section weighting factor "yphrf"
personal number "pid"
original household number "cid"
current household number "hid_2008"
sample affiliation "psample"
gender "sex"
year of birth "gebjahr"
Create an exercise path with four subfolders:

Example:
H:/material/exercises/do
H:/material/exercises/output
H:/material/exercises/temp
H:/material/exercises/log
These are used to store commands, log files, datasets, and temporary datasets. Open an empty do file and define your created paths with globals:
1***********************************************
2* Set relative paths to the working directory
3***********************************************
4global MY_PATH_IN   "\\hume\rdc-prod\distribution\soep-core\soep.v37\eu\Stata\raw\"
5global MY_PATH_OUT  "H:\Exercise\"
6global MY_FILE_OUT  "${MY_PATH_OUT}cross-sectional-exercise.dta"
7global MY_LOG_FILE  "${MY_PATH_OUT}cross-sectional-exercise.log"
8capture log close
9log using "${MY_LOG_FILE}", text replace
The global “AVZ” defines the main path. The main paths are subdivided using the globals “MY_IN_PATH”, “MY_DO_FILES”, “MY_LOG_OUT”, “MY_OUT_DATA”, “MY_OUT_TEMP”. The global “MY_IN_PATH” contains the path to your data.
Use ppath as the source file together with the required variables. Keep all cases with completed interviews. In addition, your dataset should only contain respondents who can make a statement on the content of the question. For example, you can use the net code to identify and remove children from your dataset.
 1* * * PFAD * * *
 2
 3use ypop cid sex hid_2008 pid psample ynetto gebjahr using "${MY_PATH_IN}ppfad.dta", clear
 4
 5
 6* * * BALANCED VS UNBALANCED * * *
 7
 8keep if ( (ynetto >= 10 & ynetto < 20) )
 9
10
11* * * PRIATVE VS ALL HOUSEHOLDS * * *
12
13keep if ( (ypop == 1 | ypop == 2) )
14
15
16* * * SORT PFAD * * *
17
18save "${MY_PATH_OUT}pfad.dta", replace
19clear
Save the modified data temporarily. Now link your dataset with the weights of the SOEP and save your dataset as a master file.
 1* * * HRF * * *
 2
 3use cid pid yphrf prgroup using "${MY_PATH_IN}phrf.dta"
 4sort pid
 5save "${MY_PATH_OUT}hrf.dta", replace
 6clear
 7
 8
 9* * * CREATE MASTER * * *
10
11use "${MY_PATH_OUT}pfad.dta", clear
12merge 1:1 pid cid using "${MY_PATH_OUT}hrf.dta", keep(master match) nogen
13save "${MY_PATH_OUT}master.dta", replace
14clear
Now prepare the content variables. Search for the content variables you are looking for from the various datasets and temporarily save the datasets you have created.
 1* * * READ DATA * * *
 2
 3use emplst08 pid using "${MY_PATH_IN}ypgen.dta", clear
 4save "${MY_PATH_OUT}ypgen.dta", replace
 5
 6
 7use yp0101 pid yp10601 using "${MY_PATH_IN}yp.dta", clear
 8save "${MY_PATH_OUT}yp.dta", replace
 9
10
11use hinc08 hid_2008 using "${MY_PATH_IN}yhgen.dta", clear
12save "${MY_PATH_OUT}yhgen.dta", replace
Link the datasets you have created to your master file and save for analysis.
 1* * * MERGE DATA * * *
 2
 3use   "${MY_PATH_OUT}master.dta", clear
 4merge 1:1 pid using "${MY_PATH_OUT}ypgen.dta", keep(master match) nogen
 5merge 1:1 pid using "${MY_PATH_OUT}yp.dta", keep(master match) nogen
 6merge m:1 hid_2008 using "${MY_PATH_OUT}yhgen.dta", keep(master match) nogen
 7
 8
 9* * * DONE * * *
10
11label data "paneldata.org"
12save "${MY_FILE_OUT}", replace
13desc
14
15log close
You have successfully created a cross-sectional dataset for the year 2008.
2. Encode missing values into system missings (STATA)!
In SOEP, the missing codes of variables are described in detail with the values -1 to -8. To learn more about missing codes, see the section Missing Conventions. For content analysis, it is not always necessary to differentiate missing codes. Therefore you should be able to convert missing codes:
 1use "${MY_FILE_OUT}", clear
 2
 3
 4********************************************************************************
 5*** Exercise 2) ***
 6* Encode missing values into missing values in system missings (STATA)!
 7********************************************************************************
 8
 9* mvdecode = Change missing values to numeric values and vice versa
10	mvdecode _all, mv(-1=. \ -2=.t \ -3=.x \ -5=.y \ -8=.z)
Open the dataset for your analysis and summarize all missing codes.
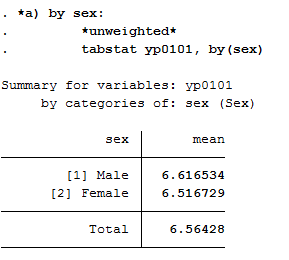
3. How does average health satisfaction differ a) by gender
Satisfaction was measured on a scale of 1 to 10. To compare average satisfaction with health between women and men, you should display the mean value for both genders.
1	*unweighted*
2	tabstat yp0101, by(sex)
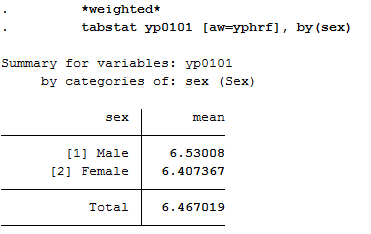
Since you have previously added the SOEP weighting factors to the dataset for your analysis, you should use the weighting for a representative analysis.
1	*weighted*
2	tabstat yp0101 [aw=yphrf], by(sex)
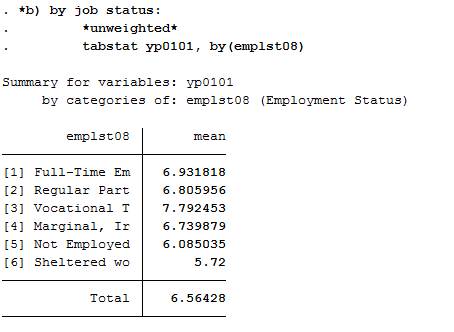
b) Employment status
Now proceed in a similar way when comparing satisfaction with health and employment status. Compare the mean values again:
1*b) by job status:
2	*unweighted*
3	tabstat yp0101, by(emplst08)
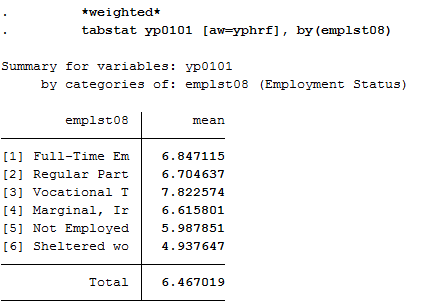
Since you have previously added the SOEP weighting factors to the dataset for your analysis, you should use the weighting for a representative analysis.
1	*weighted*
2	tabstat yp0101 [aw=yphrf], by(emplst08)
c) Age
Since you do not have a variable that represents age, you must generate a suitable age variable using the birth year variable. The year of birth is metric and should be categorized for analysis. Define categories for your age variable and assign suitable labels.
1*c) by age in 2008 (<30, 30-64, 65+)
2
3	gen age=2008-gebjahr
4	gen age_3=age
5	recode age_3 (17/29=1) (30/64=2) (65/120=3)
6	label define age_3 1 "17-29" 2 "30-64" 3 "65+"
7	label values age_3 age_3
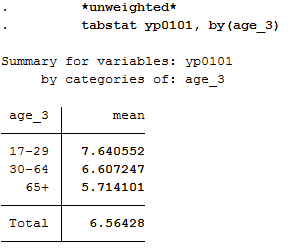
Create a mean value comparison with your age variable and health satisfaction in weighted and unweighted form.
1	*unweighted*
2	tabstat yp0101, by(age_3)
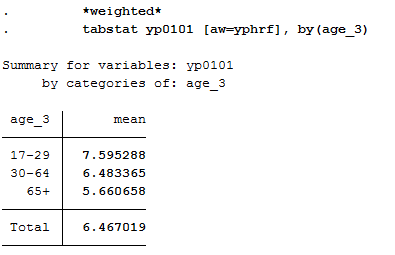
1	*weighted*
2	tabstat yp0101 [aw=yphrf], by(age_3)
d) Income
As with age, generate a categorized version of income for household net income:
1*d) by monthly houshold net income (-1.999, 2.000-3.999, 4000+ Euro)
2	gen hinc08_3 = hinc08
3	recode hinc08_3 (0/1999=1) (2000/3999=2) (4000/99999=3)
4	label define hinc08_3 1 "<2000 Euro" 2 "2000-<4000 Euro" 3 "4000+ Euro"
5	label values hinc08_3 hinc08_3
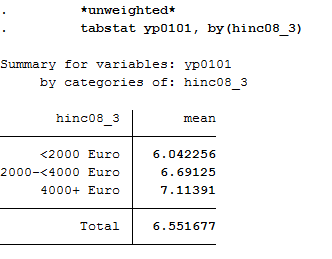
Display the mean values in weighted and unweighted form:
1	*unweighted*
2	tabstat yp0101, by(hinc08_3)
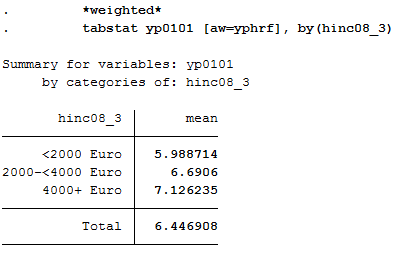
1	*weighted*
2	tabstat yp0101 [aw=yphrf], by(hinc08_3)
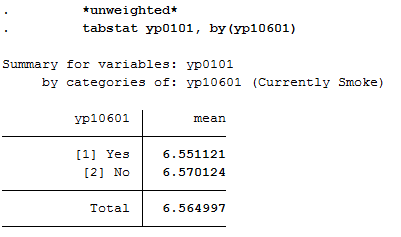
e) Smoking
Since this variable is nominal, adjustments to this variable are not necessary. Display average satisfaction with health for smokers and non-smokers in weighted and unweighted form:
1*e) by smoking yes/no
2
3	*unweighted*
4	tabstat yp0101, by(yp10601)
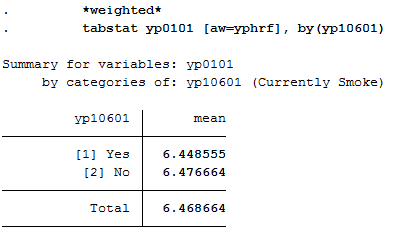
1	*weighted*
2	tabstat yp0101 [aw=yphrf], by(yp10601)
Last change: Apr 07, 2026