Development of Sample Sizes
Individuals who decline to take part in the survey or are not available for an interview are kept in the so-called “gross” sample of the study as long as they continue to live in households with at least one participating respondent. If the entire household declines to participate in two consecutive waves, all individuals in the household are removed from the SOEP.
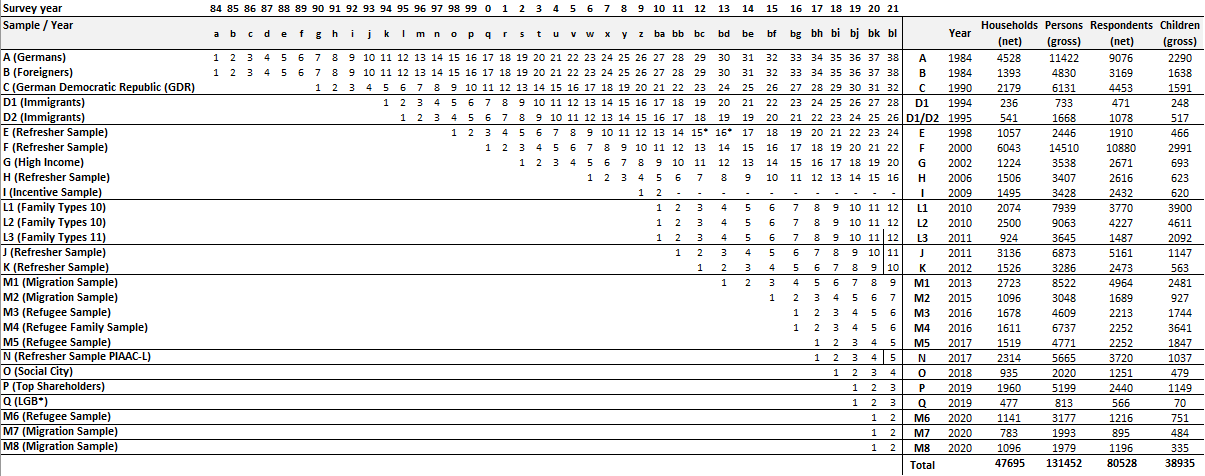
The table shows the starting sample sizes of samples A until current samples, the years when the samples were first collected, as well as the percentage of those persons who were eligible for an interview but declined participation (“partial unit non-response”, PUNR) in the first wave. The figure illustrates the development of the number of successful person interviews since 1984. The reduction in the population size for all individual samples is mainly the result of individual-level drop-outs, refusals, moving abroad, etc. However, due to new persons moving into already existing households and children reaching the age of 16 and thereby increasing the sample size, this negative development is offset somewhat.
Starting Sample Size of the SOEP Samples
Cross-Sectional Development of Sample Size (Respondents)
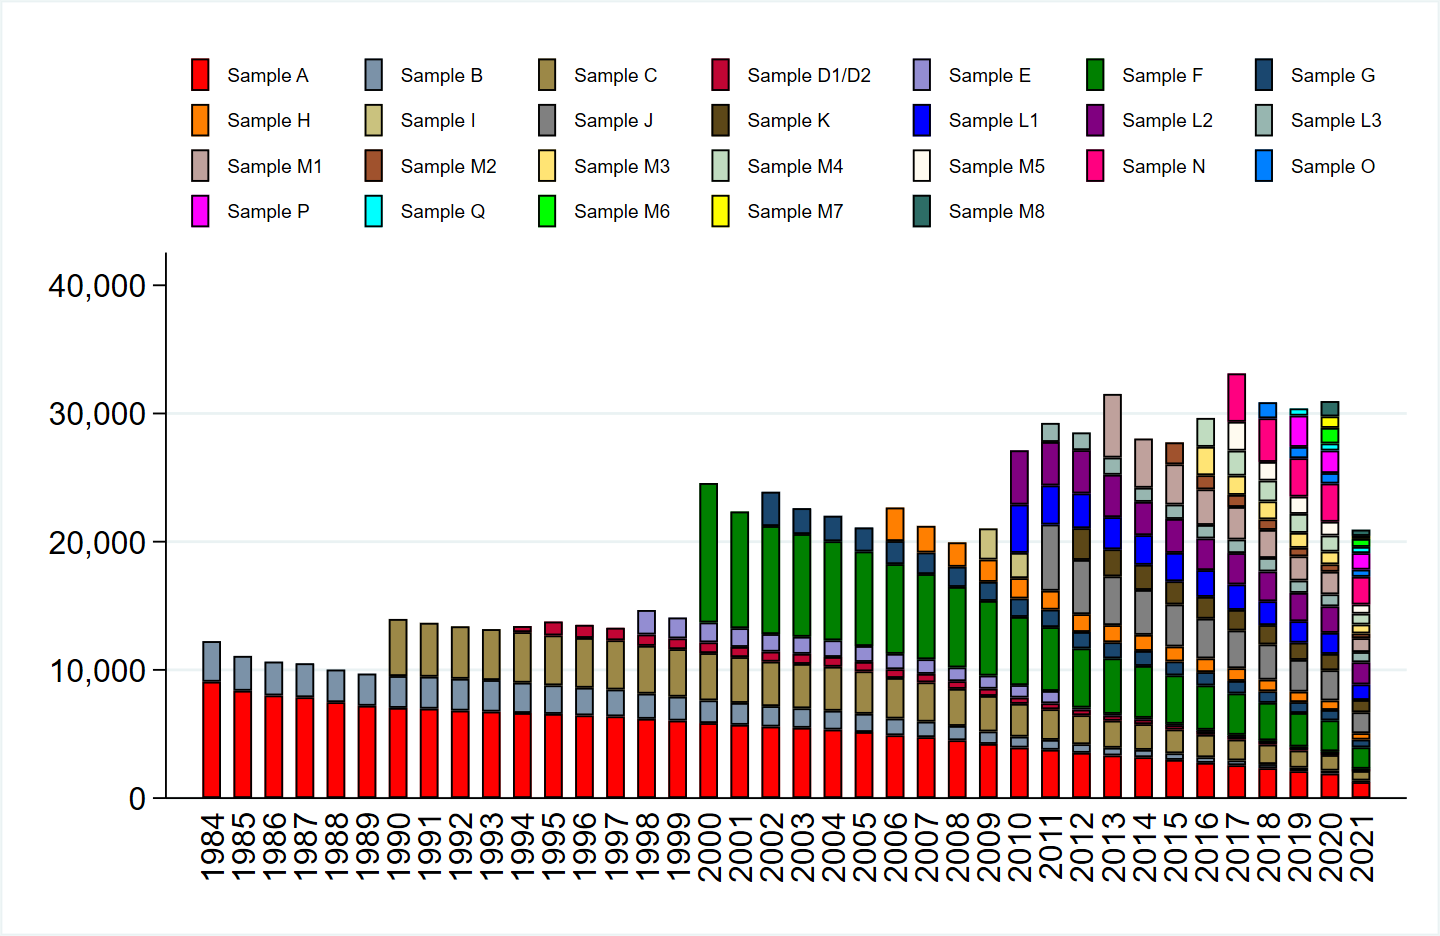
Download Stata Code to create figure
This cross-sectional view is insufficient when examining the longitudinal development of the sample, which is influenced by different demographic and fieldwork-related factors. As already shown, demographic reasons for entering the panel are birth and residential mobility. Analogously, the demographic reasons for a panel exit are death and moving abroad. Fieldwork-related reasons are different, in that they relate to the interaction between the interviewer and the responding household. Respondents are either not reached for an interview (non-contact) or they decline to participate for the current year. The figure illustrates the longitudinal development of first-wave respondents in 1984, as well as their children, of samples A and B.
Longitudinal Development of the 1984 Population
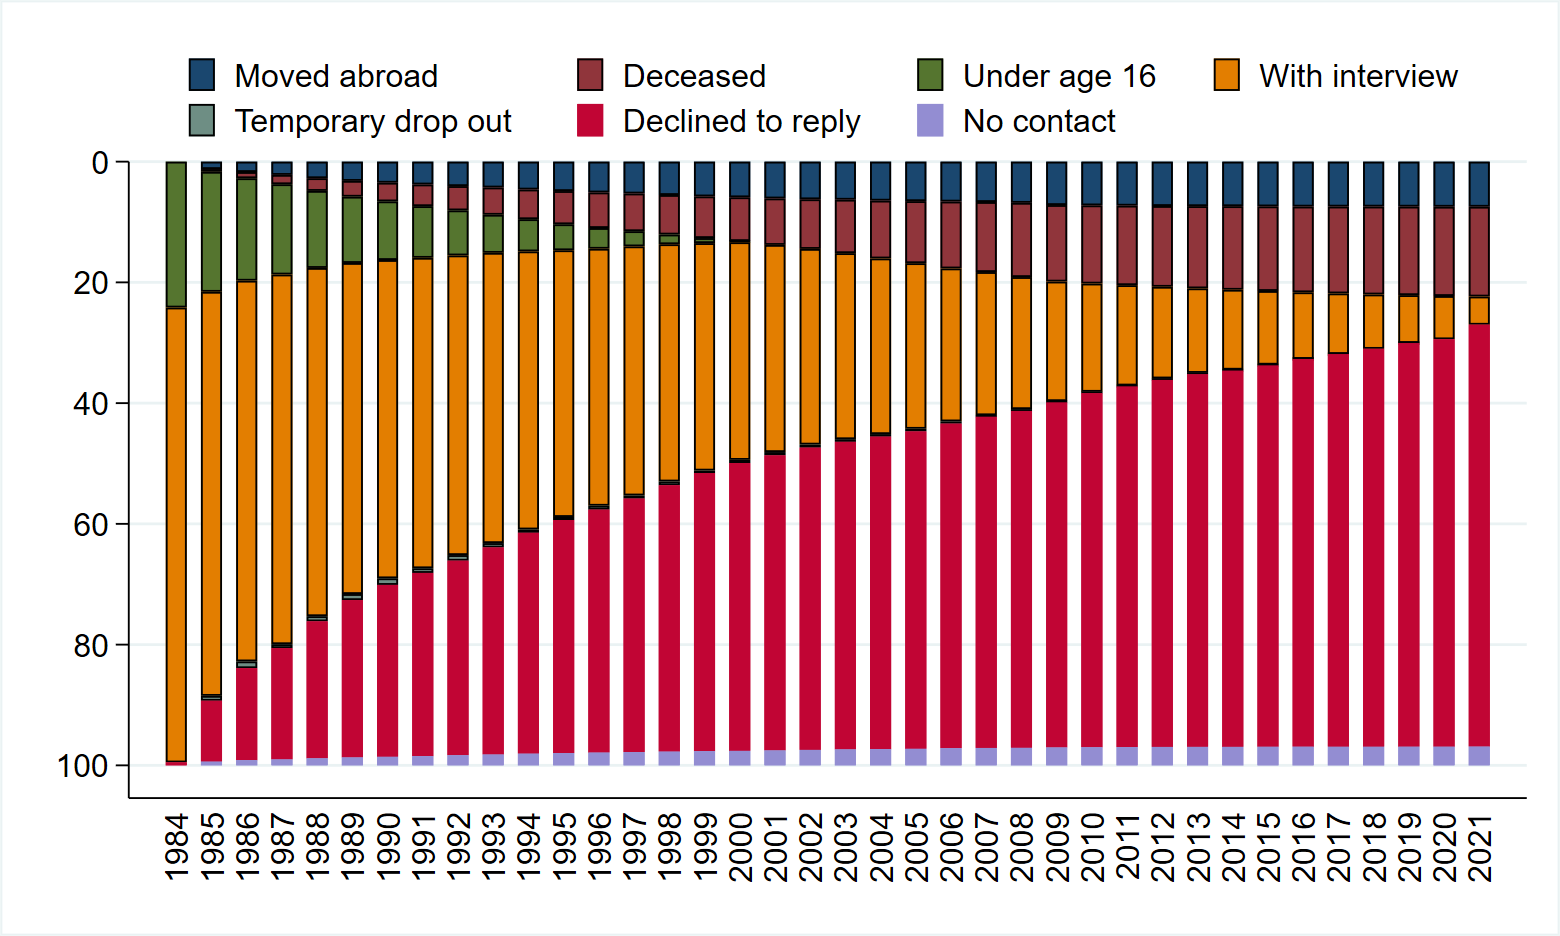
Download Stata Code to create figure
Last change: Apr 07, 2026