Variable Search with paneldata.org
Paneldata.org also allows you to search for variables and to find more information about generated variables. It offers comprehensive frequency counts, chronologies of variables, cross-study variable linkage via concepts, a syntax generator, and a topic list for content search in the SOEP.
Example Variable:
bbh5508: Wave “bb” (Survey Year 2011); household questionnaire (“h”), question number 55, item 8
Open Paneldata
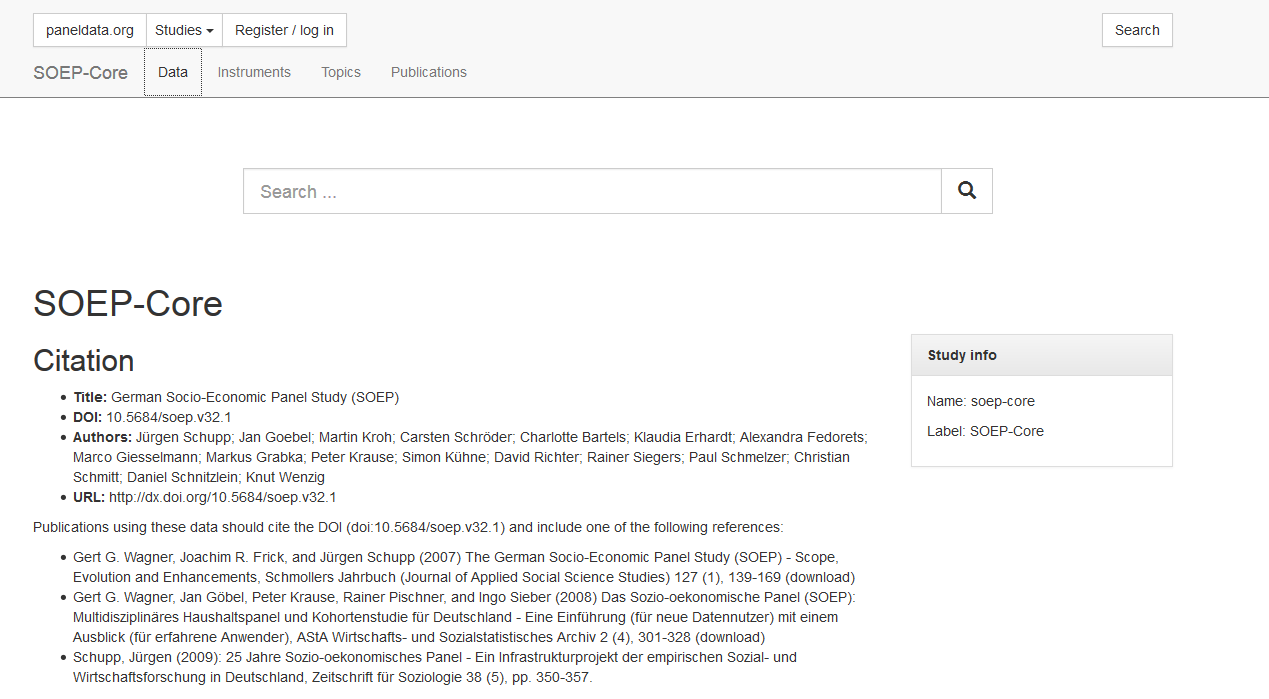
Select the study SOEP-Core. The SOEP-Core overview contains important general information about the study, e.g., data access, survey method, questionnaires, themes, terms for missing codes, all available datasets in the study and metadata-based questionnaires. To search for a variable, a dataset, or a publication, simply enter the desired search term in the search bar.
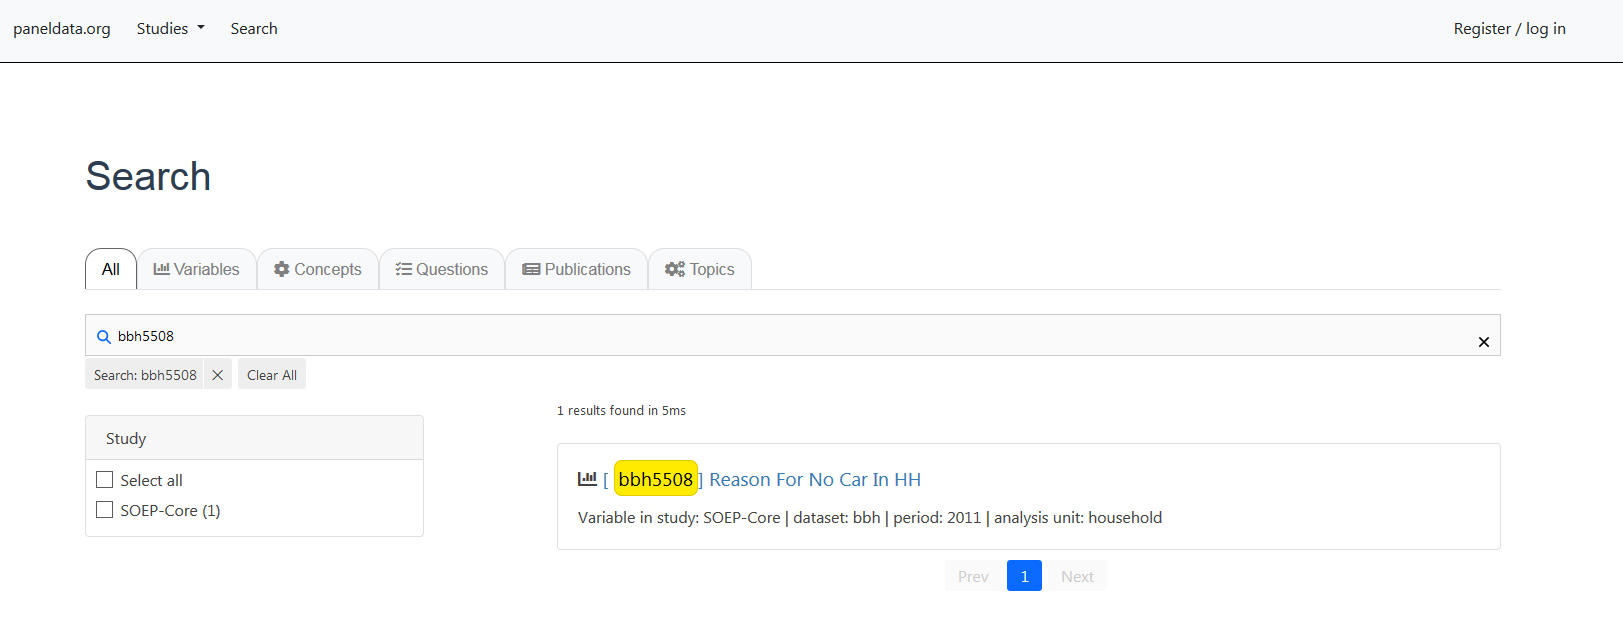
To obtain the desired results, you will need to input specific information. The results window displays all search results. You will see that the variable “bbh5508” originates from SOEP-Core data and can be found in the dataset “bbh” (survey year 2011). If your search is not so specific, you can also search by keywords. We are still interested in the topic “car”.
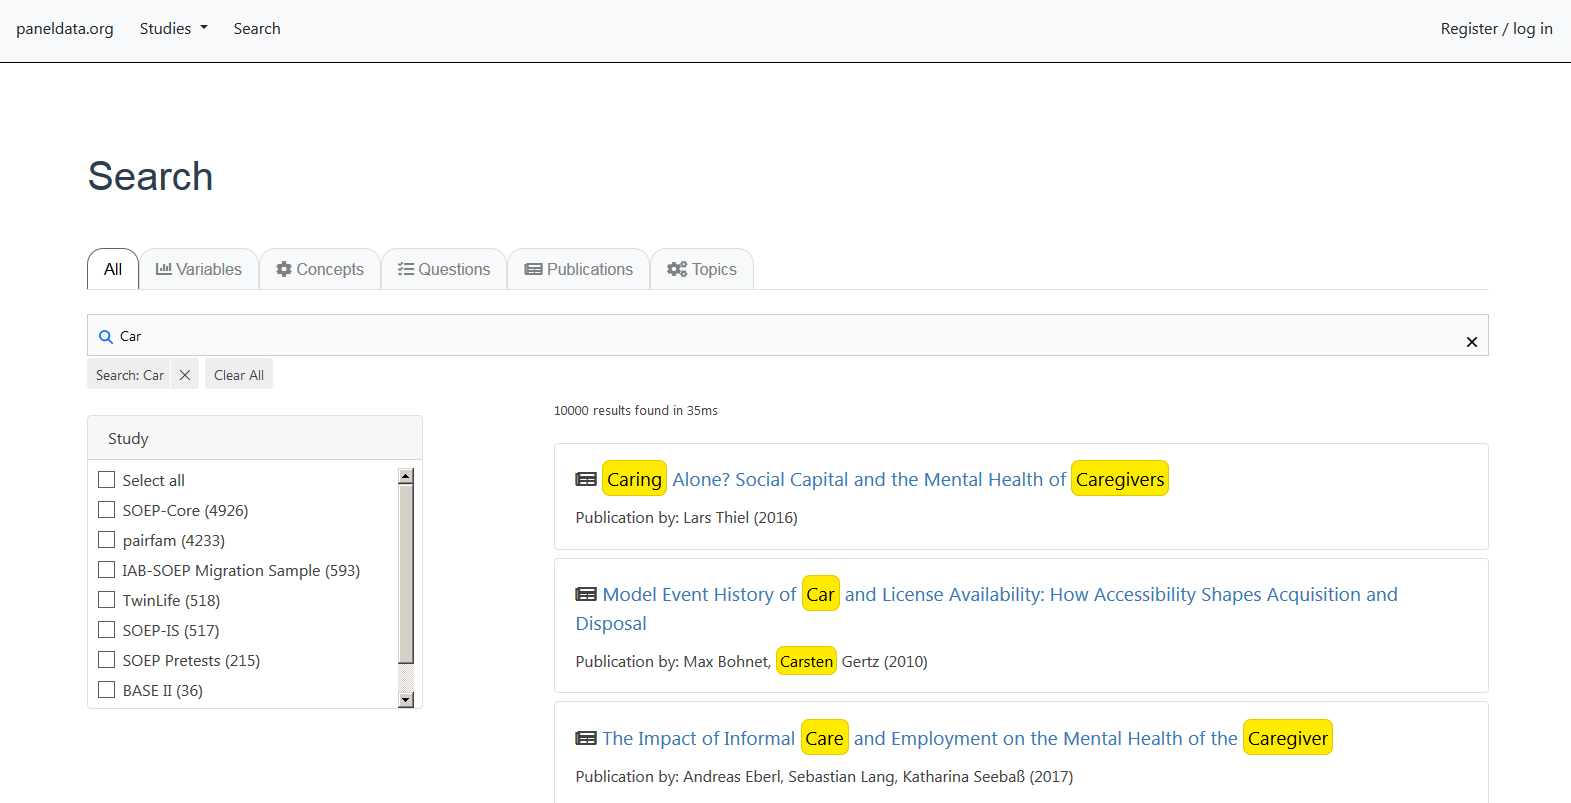
To better limit the 10000 results, the filter options on the left and on the top should be used. We are looking for variables from the “SOEP-Core” datasets. The search results should be limited with the filter options. Which survey years are of interest to me, do I want to work with original data or generated data? For more information about the different datasets in SOEP-Core, see the section Data Distribution File. Should the variable I am looking for be at household level or at individual level?
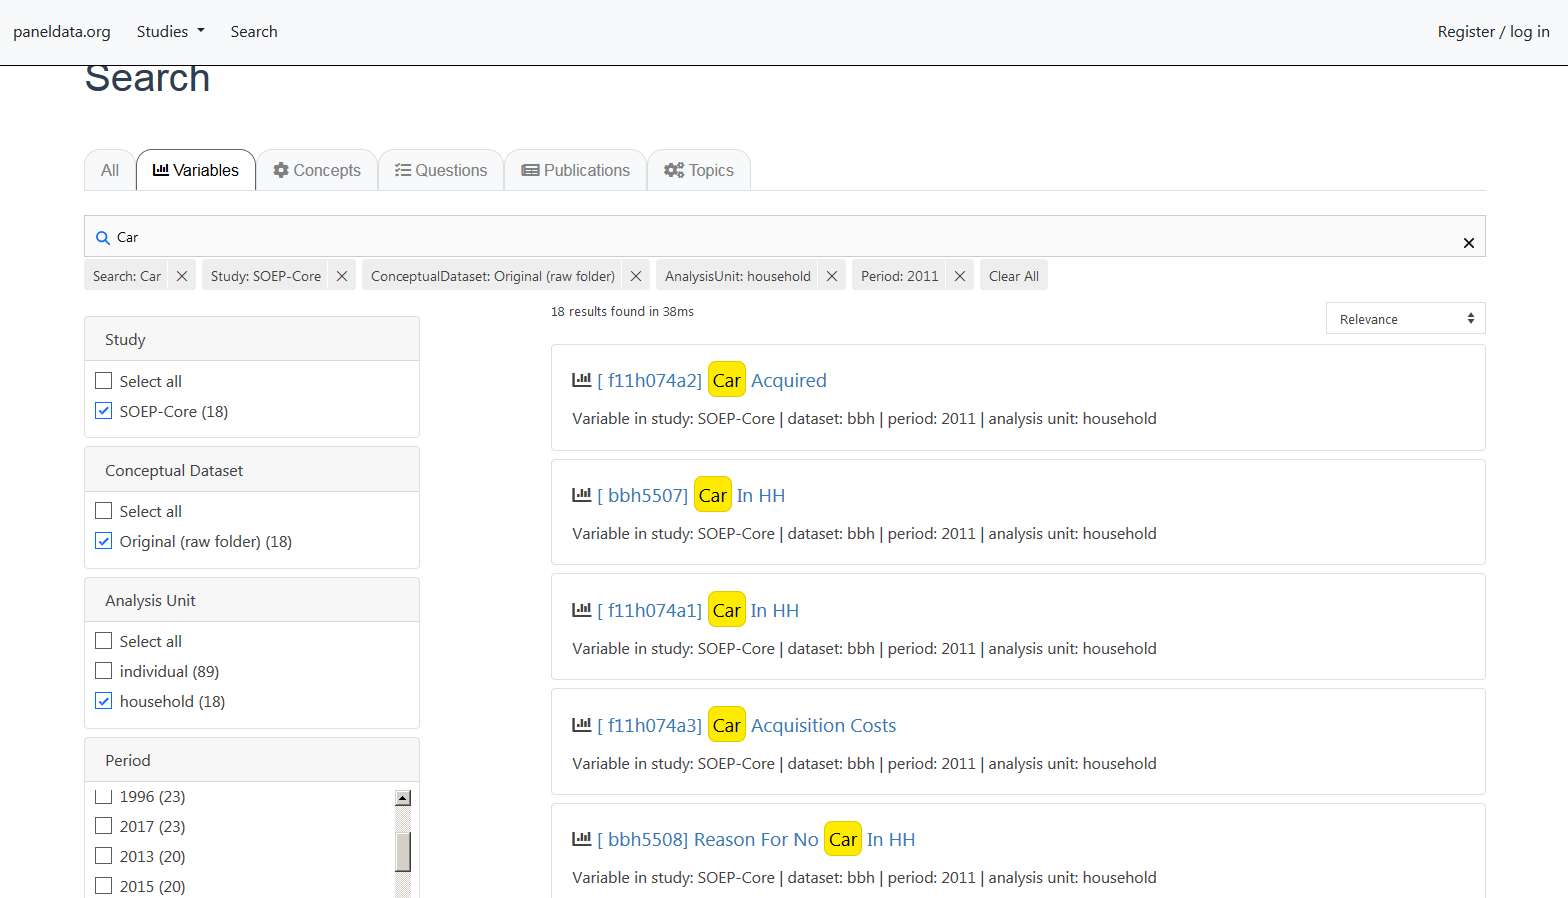
By filtering, the search result is limited to 18 hits, which also shows the variable we searched for. If you click on the variable “bbh5508”, you will find additional information about the variable.
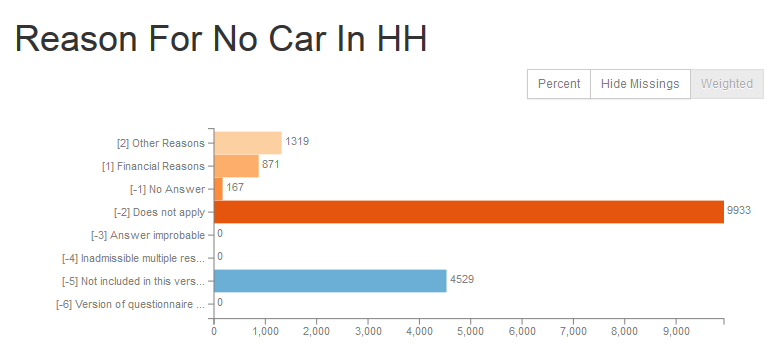
First you see the weighted absolute frequencies for the variable. It is possible to remove the missing codes from the analysis and/or to display the relative frequencies. Even without opening the dataset, paneldata obgain a good overview of the frequencies of a variable.
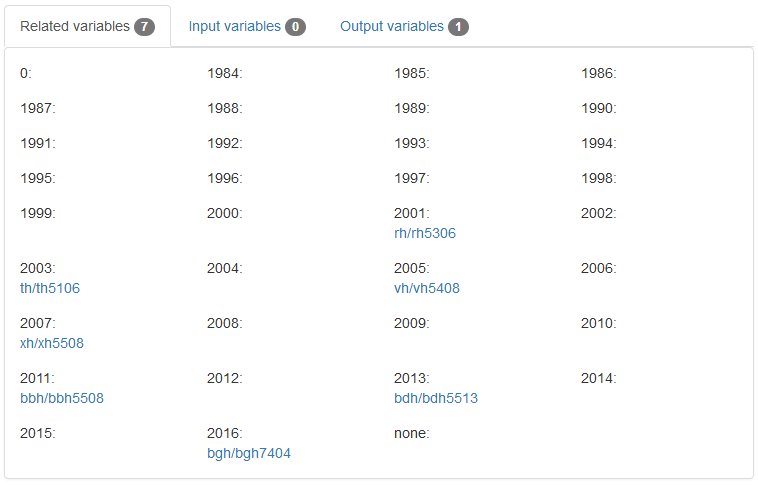
In the Related Variables section you will also find the chronology of the variable you are looking for. The sample variable was collected in 2001, 2003, 2005, 2007, 2011, 2013. Below the survey year, the name of the variable in the respective year is displayed and can be clicked to access the respective variable page. You can see at a glance when the variable was measured, how often it was measured, and what its name is in the respective survey year.
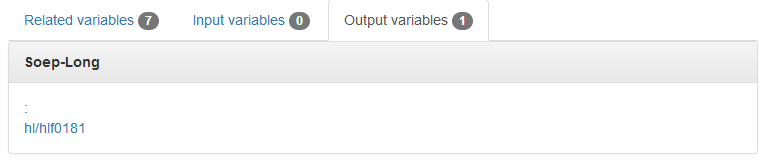
In addition, by clicking on “Output variables”, you will find a variable forwarding you to the variable in “long” format. For a more detailed understanding of the long format, read the section Data Structure in “Long” Format (long).
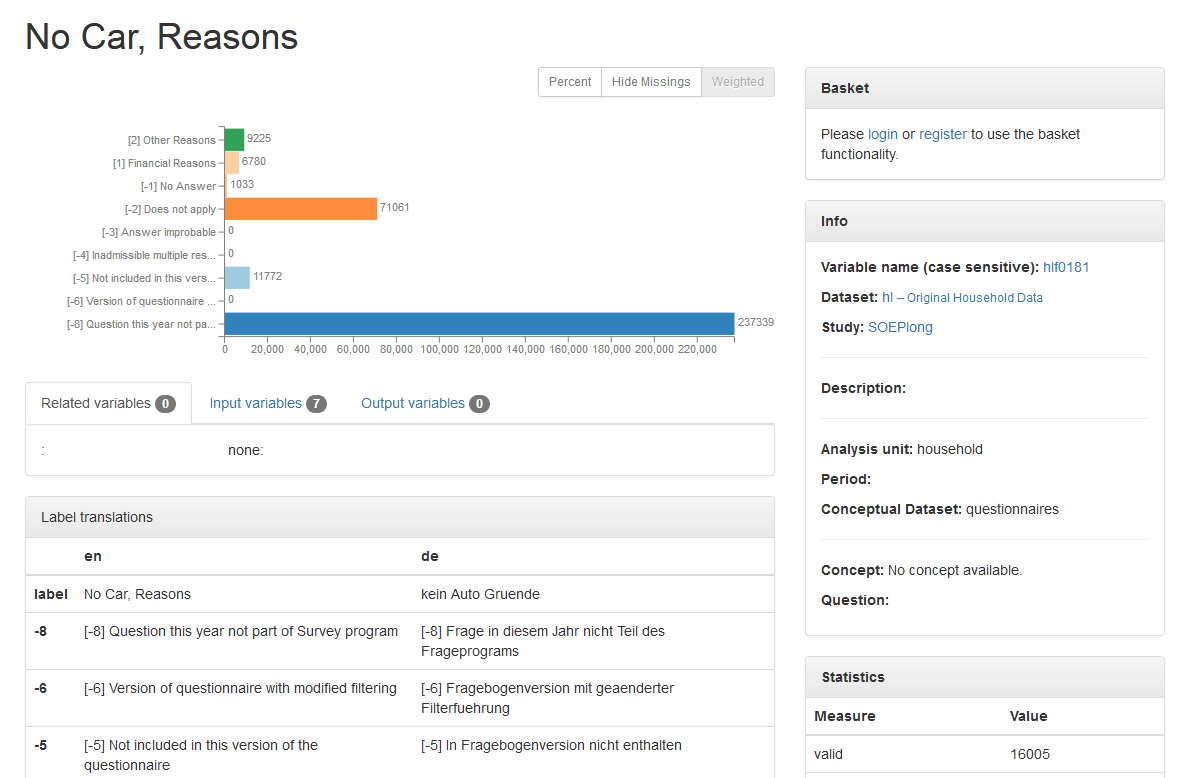
As soon as you click on the “long” variable, you will get to the variable overview for this variable in the long format. The overview of variables does not differ. It can be seen that our example variable “bbh5508” can also be found in long format in the dataset “hl” with the variable “hlf0181”.
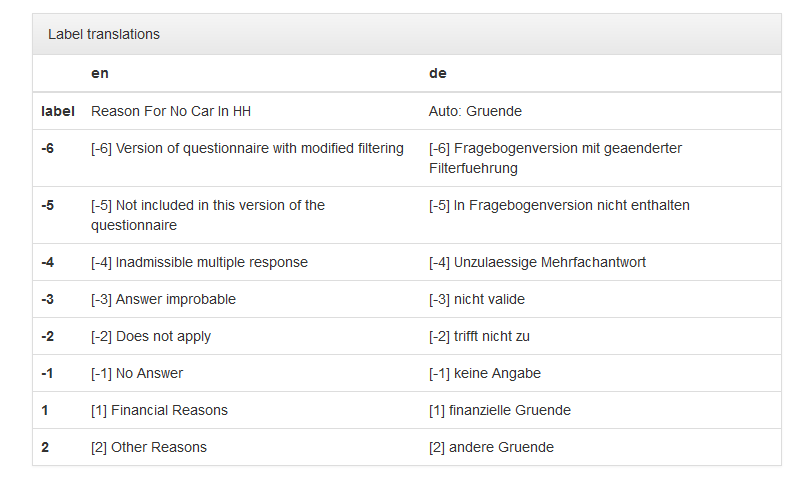
The field “Label translations” shows the value labels of the variables in German and English. In addition, all missing codes used in SOEP are listed and explained.
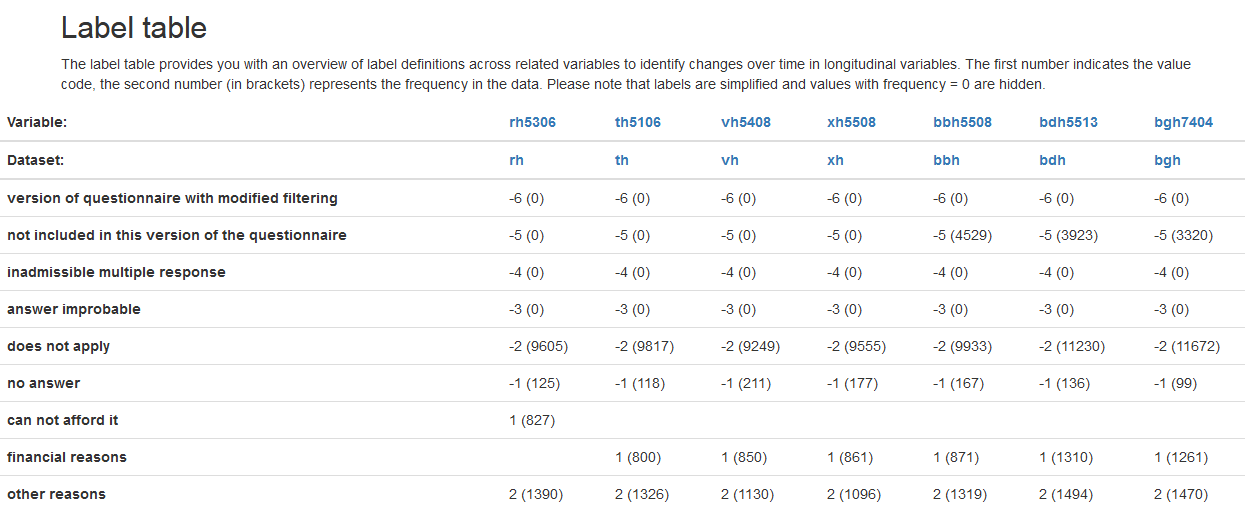
The Label window shows you the absolute frequencies of the variable at different times of data collection. This makes it possible to identify initial trends in how response behavior has changed over a period of time. The assigned value code is output for each possible characteristic value and the absolute frequencies are displayed in parentheses.
In our example, we see that for the variable “th5106” 800 respondents in the wave “t” (2003) stated “financial reasons” as the reason for not having a car in the household. For our variable “bbh5508” in survey year 2011 (wave “bb”), there were 871 respondents.
Paneldata.org is an excellent way to get an first overview of certain variables.
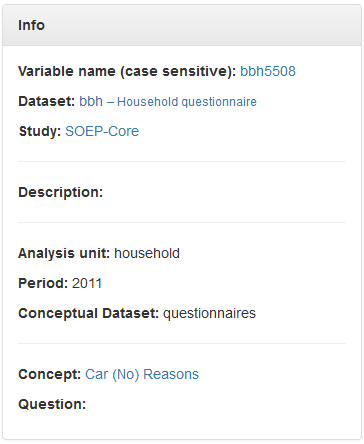
The information box on the right-hand side provides an overview of all relevant information about the variable and the dataset. In addition to basic information, you will find information about what kind of variable you are looking for under “Conceptual Dataset”. In our example “bbh5508”, you can see that variables with a “Conceptual Dataset: org/net” describe original variables that are assigned to a questionnaire. Generated variables are “Conceptual Dataset: gen”. For an overview of the different dataset types in SOEP-Core, see the section Data Distribution File.
In addition to searching for keywords or using the various filter settings, you can also find what you are looking for directly in the data set search. Open paneldata.org, click on the study SOEP-Core and select the menu option “data”.
Now you will be directed to an overview that shows you all datasets contained in SOEP-Core.
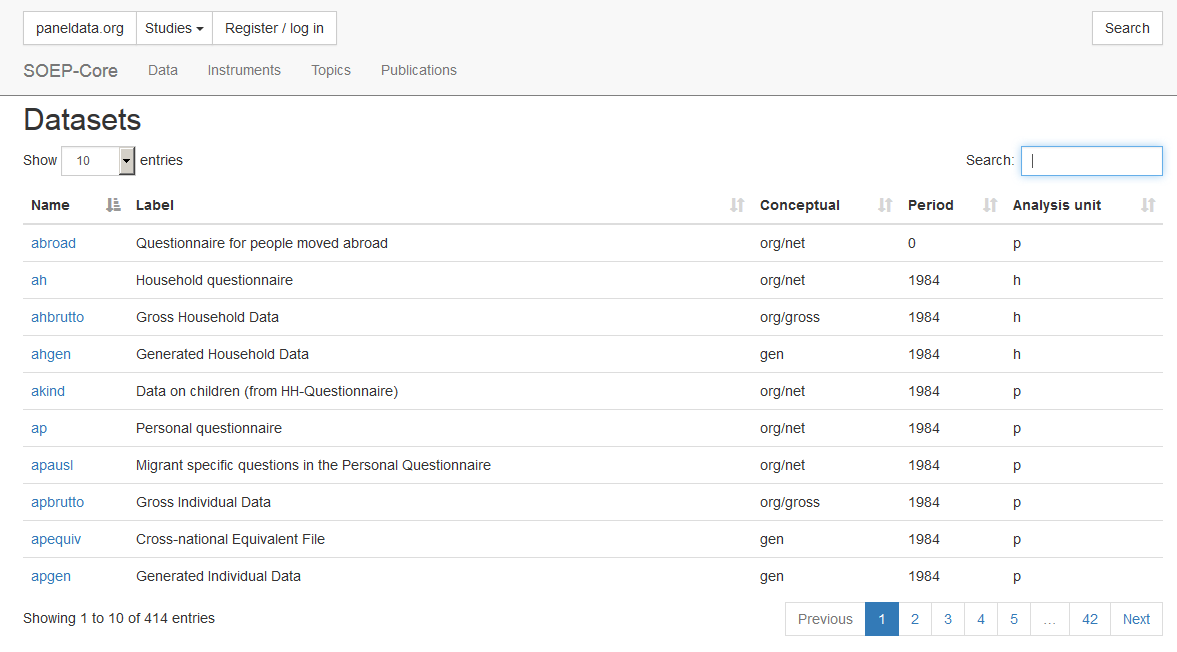
Enter the dataset you are looking for (“bbh”) in the search bar at the top right and click on the dataset. You will be directed to an overview that shows you all variables from the “bbh” dataset.
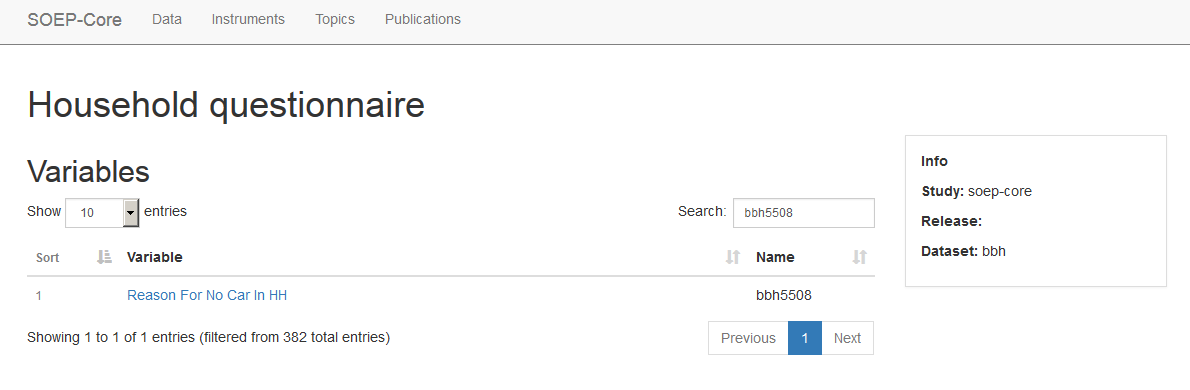
Now enter the variable you are looking for in the search bar at the top right and click on the variable of interest. You will be directed to the variable overview, where you will find detailed information on the variable. Paneldata.org offers a variety of search options to fit the user’s search needs.