Topic Search with paneldata.org
To provide an overview of the various topics in the SOEP, the variables have been grouped together on paneldata.org by topic. If you are looking for your research variables and do not want to check all datasets or questionnaires, the topic search on paneldata.org may help.
Open Paneldata and select the main study SOEP-Core. The upper navigation bar leads you to the Topics area. Click on Topics and look at the list of variables.
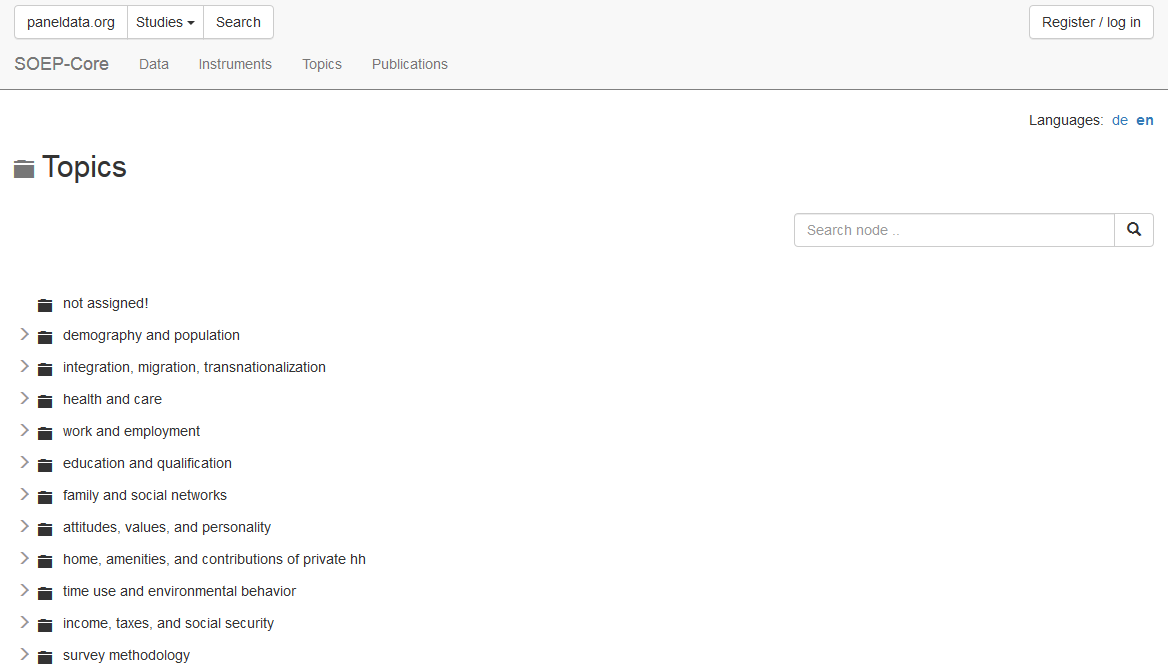
Select a topic that corresponds to your research interest, and a more detailed list of sub-topics will appear under the main topic heading.
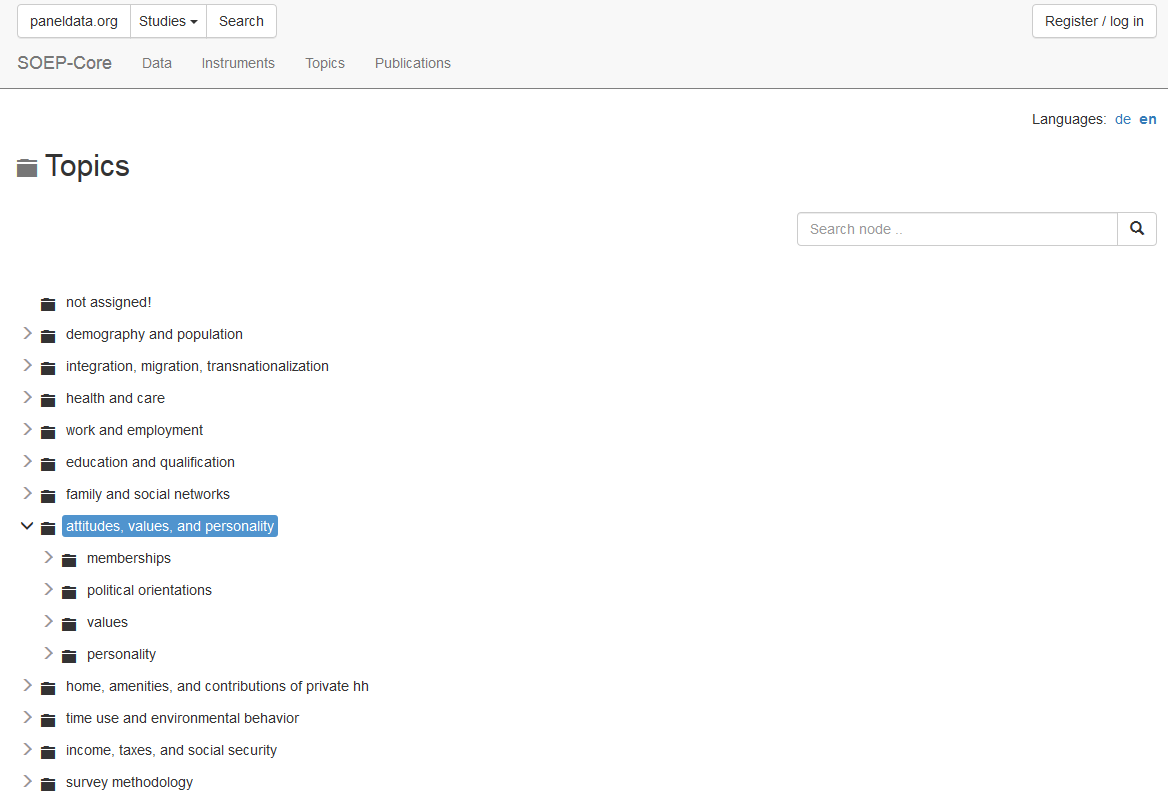
For example, if you are interested in different types of satisfaction, click on the topic “attitudes, values, and personality”. Underneath it, you will find the sub-topic “personality”. Suppose you are interested in health satisfaction. If you have found a suitable sub-topic, click on “show all the related variables”. All variables that fall under this topic will be displayed.
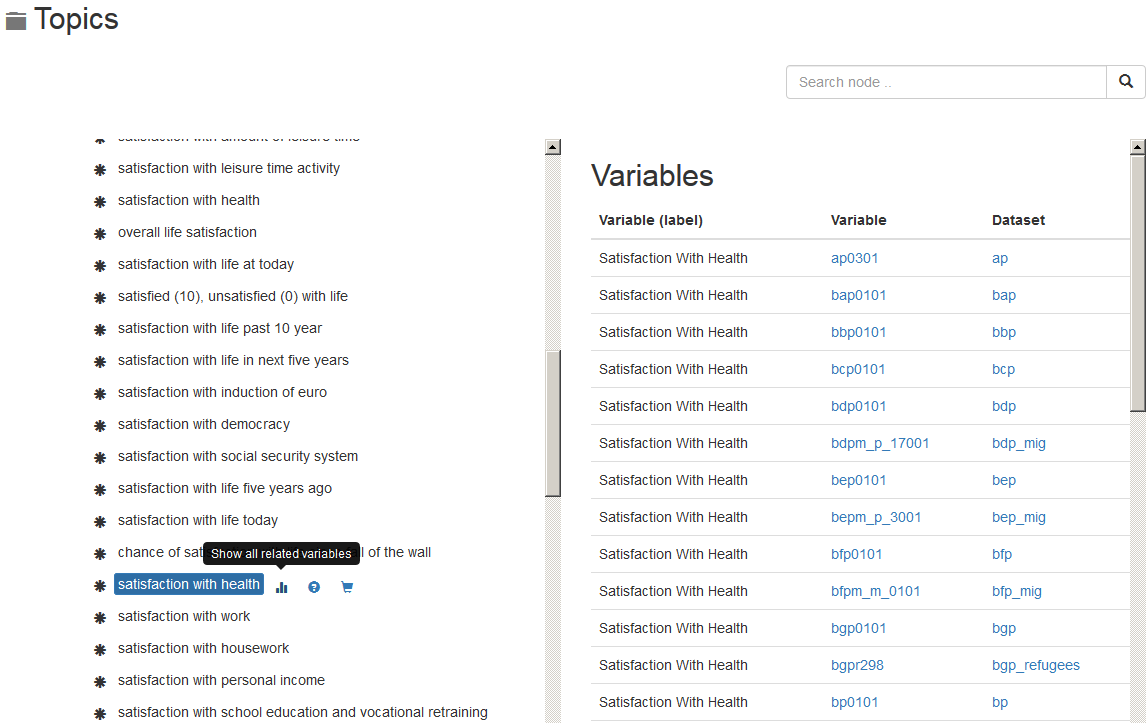
The paneldata topic list has three possible functions for each sub-topic. You can display all variables that belong to a sub-topic. In the future, paneldata will also display the texts of the questions from the SOEP questionnaires in which the variables in that sub-topic appear. Paneldata also allows you to keep variables from a sub-topic in a variable basket. The chapter Syntax Generator on paneldata.org explains in detail how to use the basket in your research and what possibilities this offers. Click on one of the variables to see the variable overview.
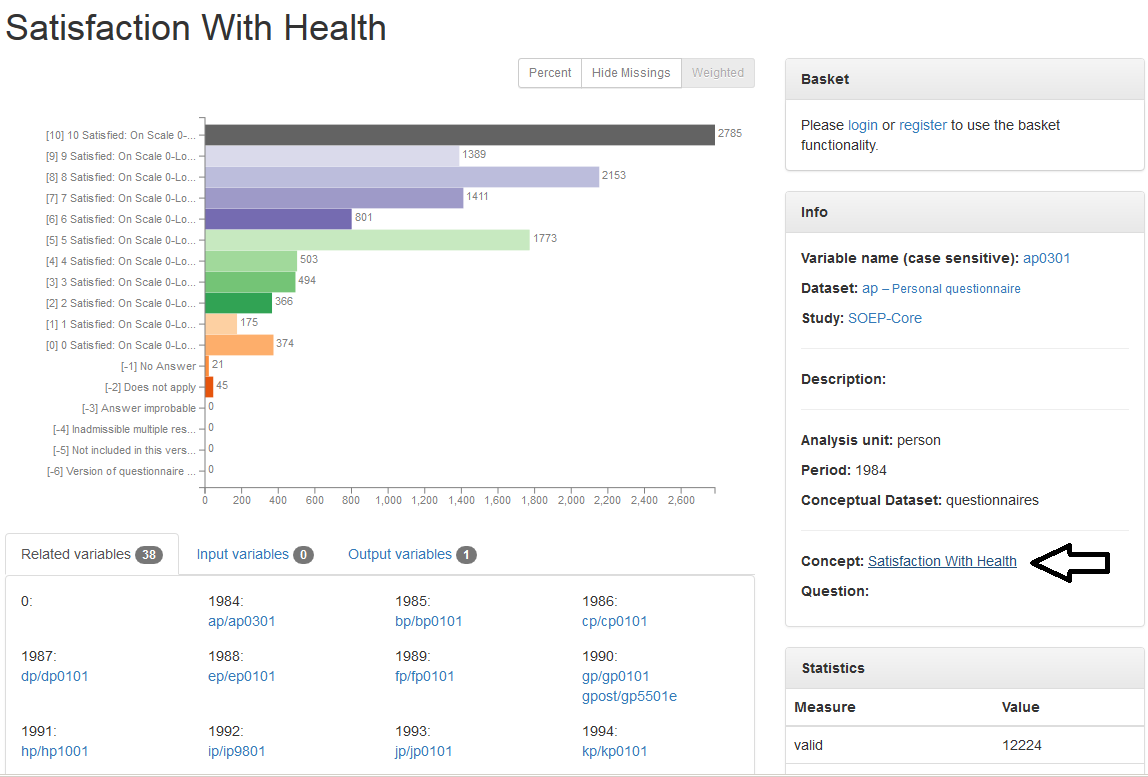
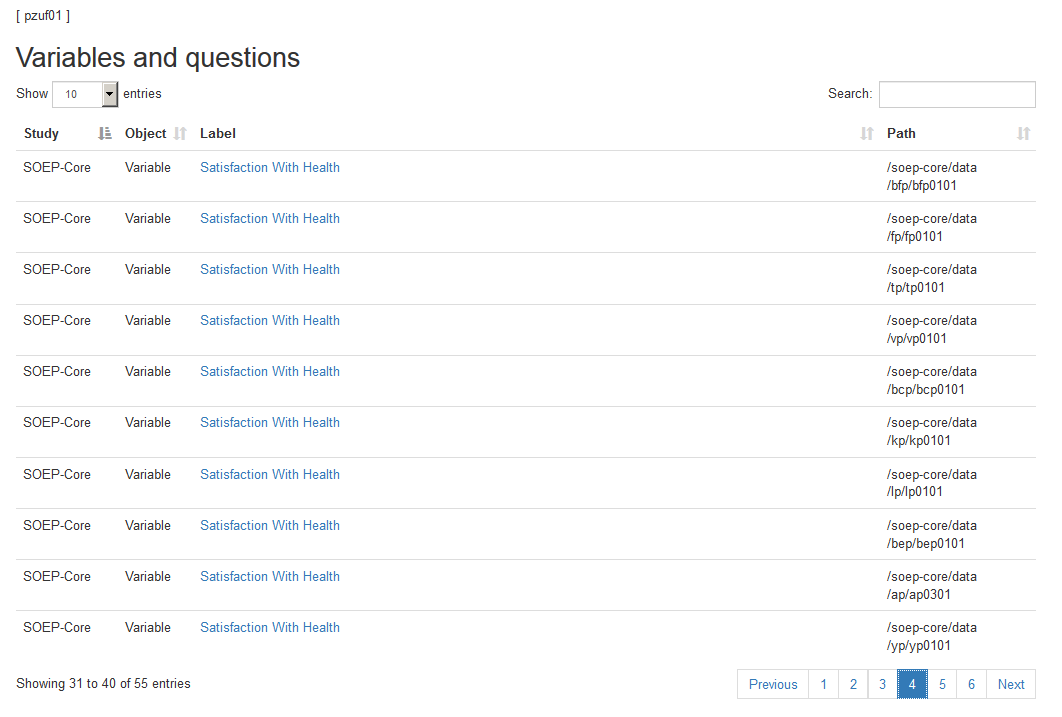
If you click on the concept of a variable, you will get to the concept overview. Concepts in SOEP are used to link variables with the same content. The concepts can even be used to link variables with the same content across studies.
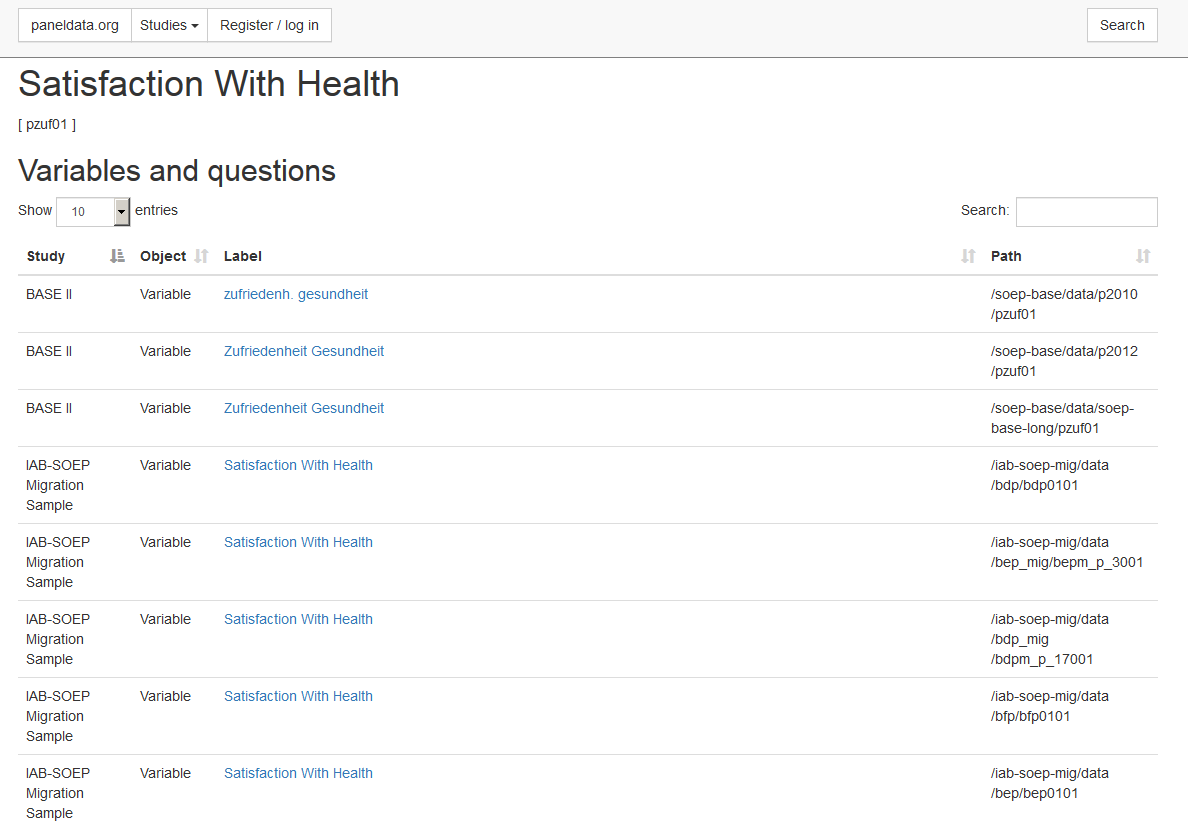
The concept overview displays the study- and wave-specific variables with this concept. The concept allows you to determine whether the variable you are looking for is also available and comparable across studies. In the column “Study” you can see which studies have the same variable linked by concept. The label of the respective variable is also displayed in the “Label” column. The column “path” shows the wave name of the variable. By clicking on the label, you will get to the overview of variables with all of the relevant information. The “Object” column in the concept overview shows you the type of information displayed.
In addition to the variables linked by concept, you can find the relevant questions in the concept overview. Questions are displayed in the “Object” column with question. Without having to open the questionnaire, you can read the question and identify possible differences. Click on the desired question and you will be taken to the question display.
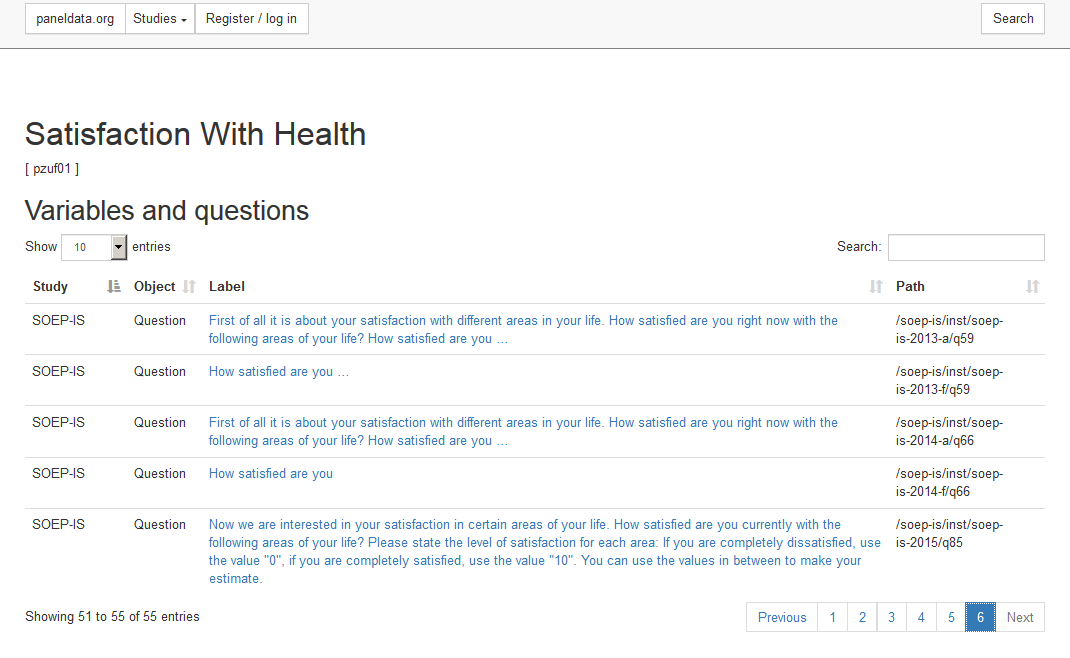
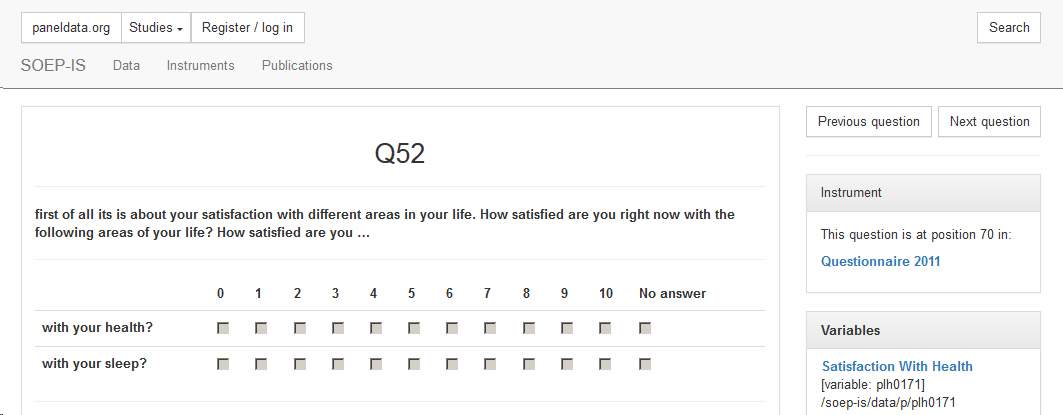
Attention: To find out the exact wording of the question and possible filter structures, a variable search in the questionnaires is necessary. The question display in Paneldata only provides a quick overview. In the question overview, you can navigate through the questionnaire using the “next question” and “previous question” buttons. The “Instrument” section shows the position of the question in the questionnaire, the survey year, and links to the metadata-based survey instrument. Click on the survey instrument “Questionnaire 2011”.
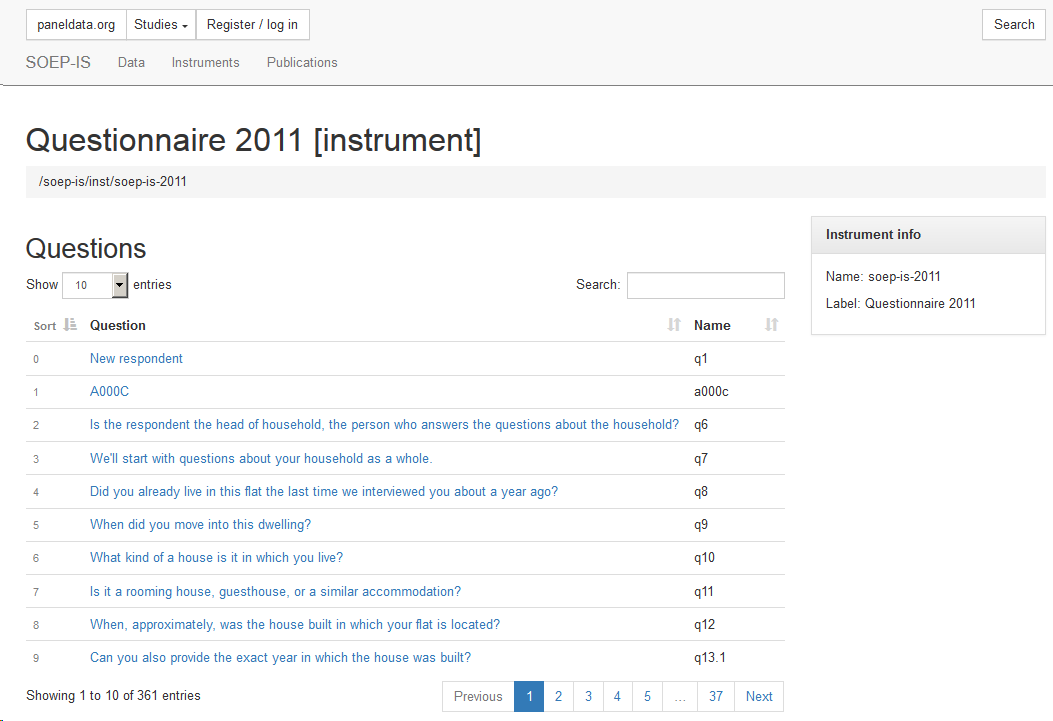
The survey instrument used in the SOEP-IS study in 2011 is now displayed. You can navigate through the questionnaire in this overview. The search bar allows you to search for research-relevant terms. Click on the question to access the question display.
Last change: Apr 07, 2026