Syntax Generator on paneldata.org
Paneldata allows registered users to collect and save variables relevant to their research in a variable basket. These variables can be simply written into a single dataset with the script generator. The script generator helps you with data management and can save valuable working time.
Open Paneldata
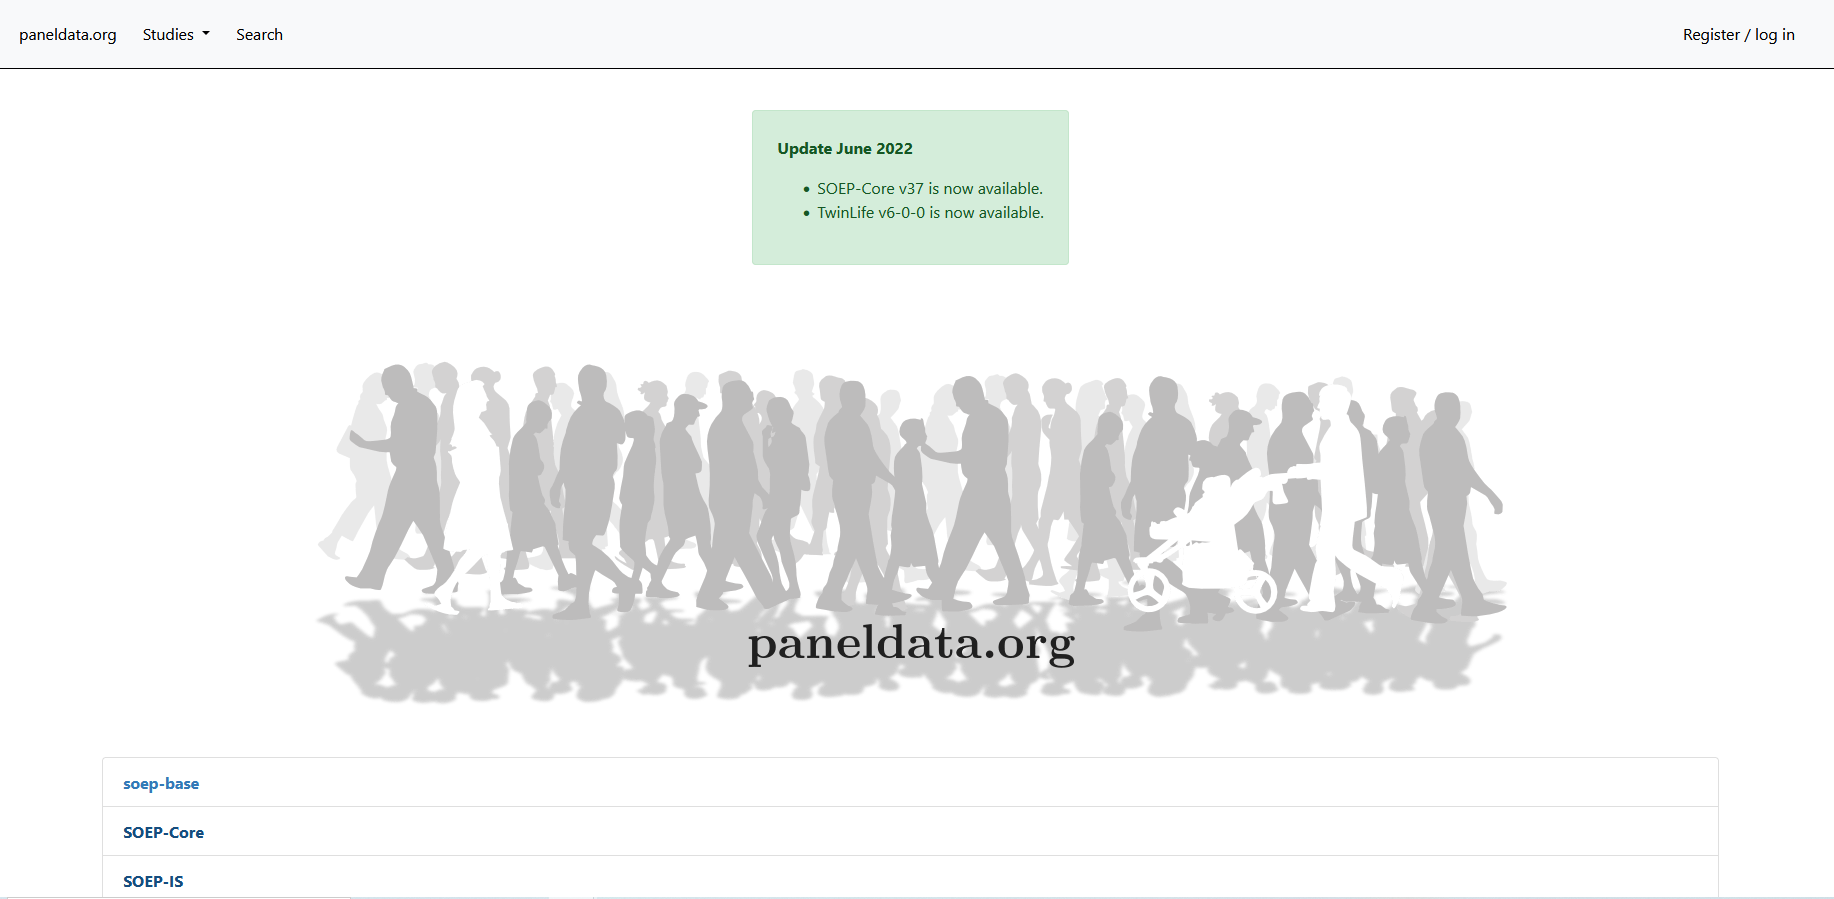
Click on “Register / login” to log in to paneldata.org.
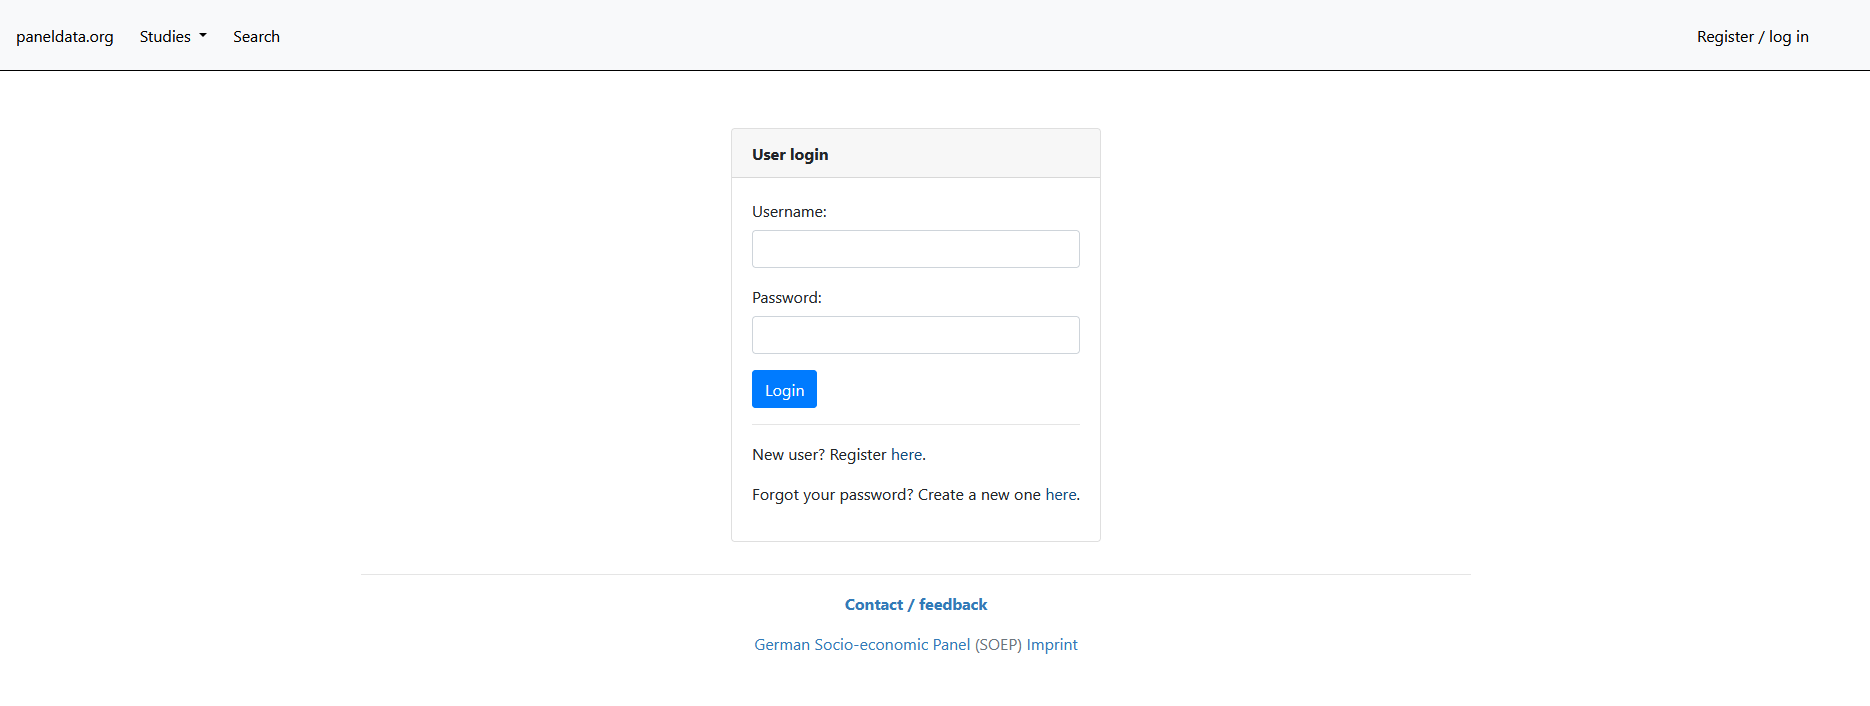
If you have already registered, go to “user login”. As a new user, you can register under “register here”. Once you have logged in, you have access to the variable basket and the syntax generator.
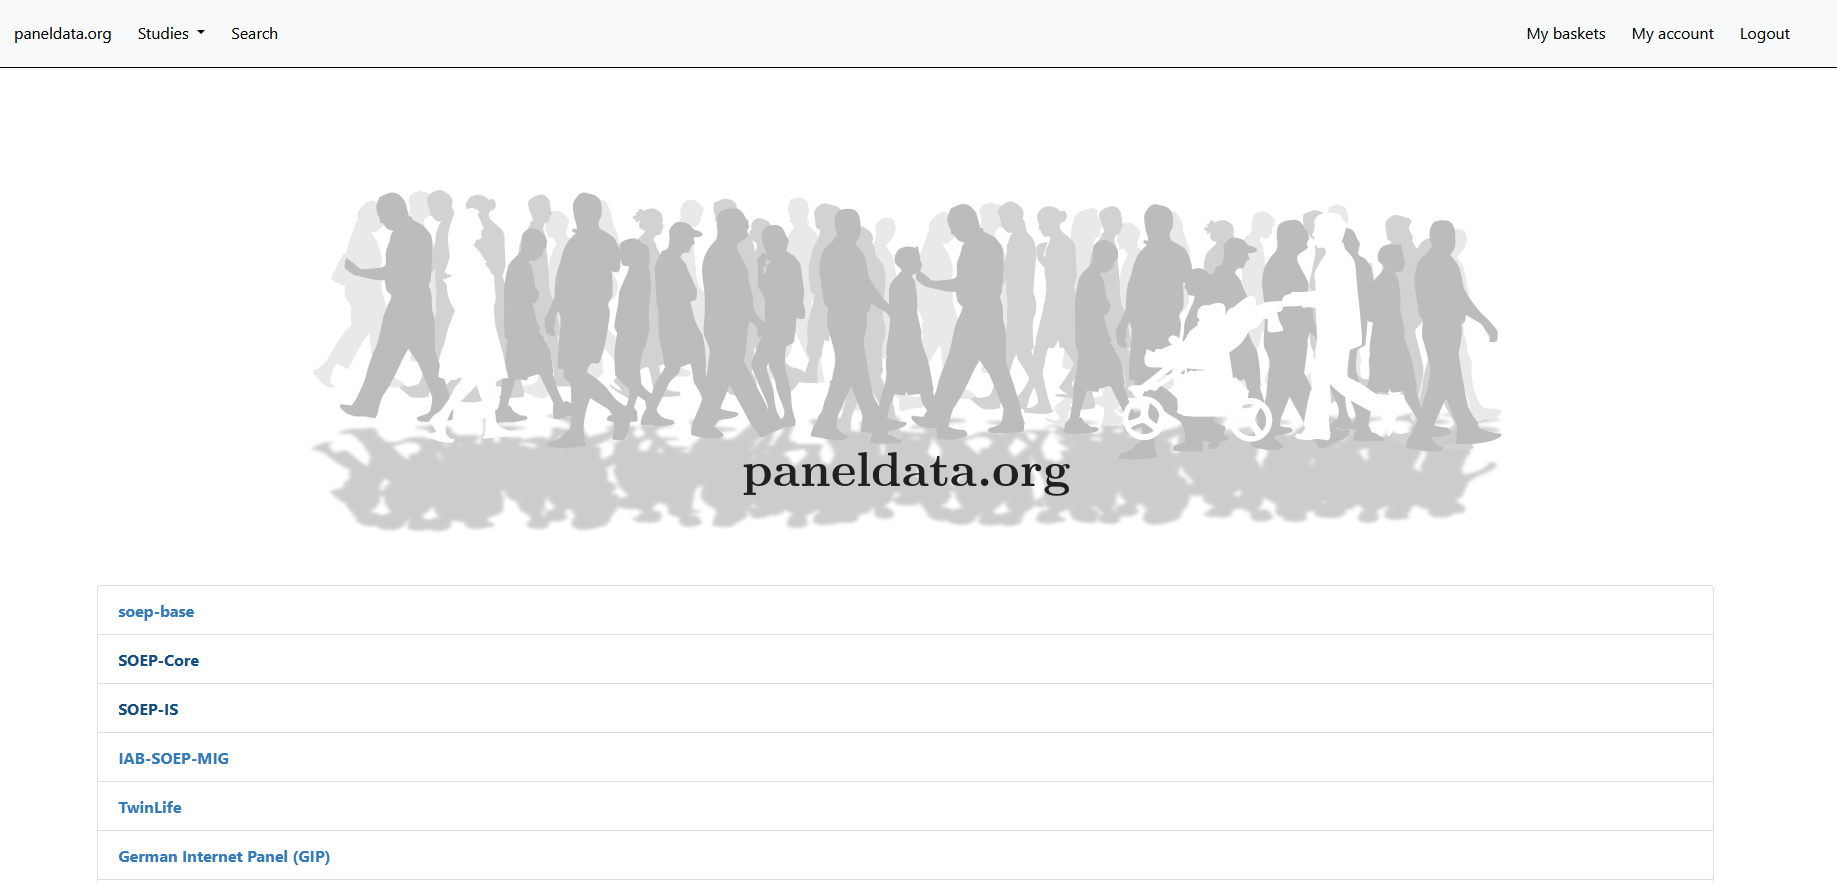
To access the activated functions, click on the button “my baskets”. You will be taken to your personal workspace on paneldata.org.
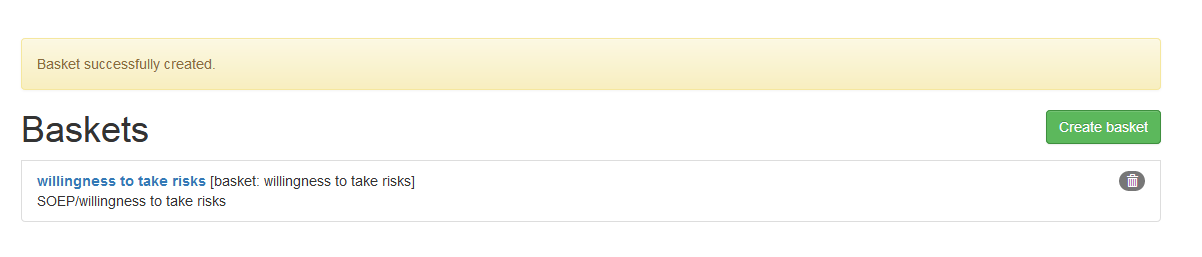
“My baskets” displays your variable baskets. If you click on “create basket”, you can create a new basket.
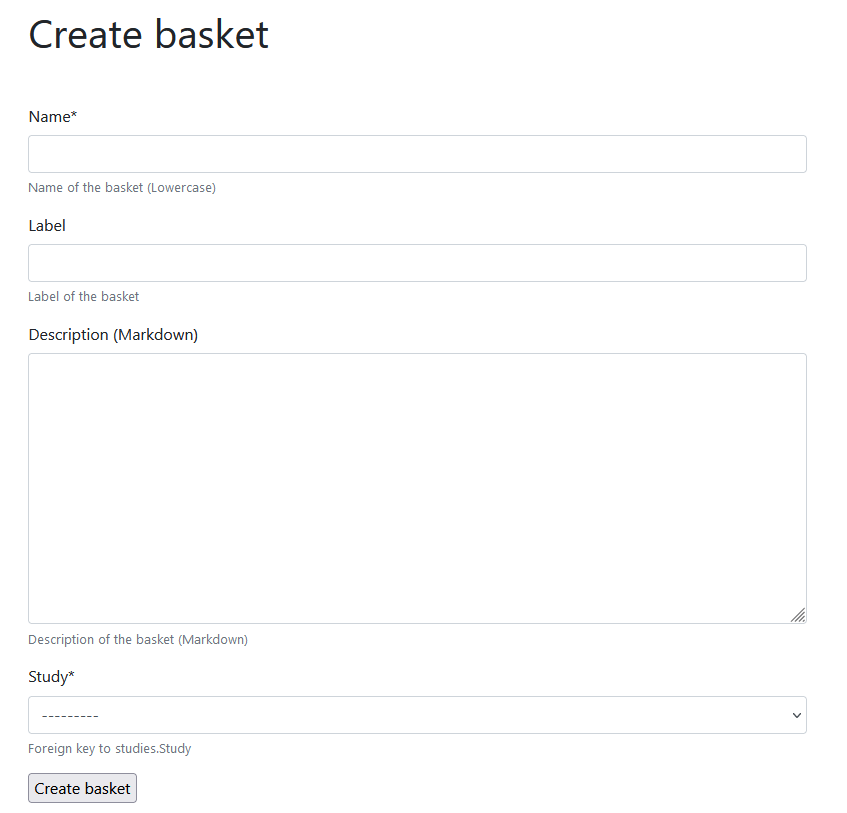
When creating the basket, first define the name of the variable basket. The name must be lower case to be accepted by Paneldata. Optionally, you can assign a label and enter a description. Finally, you select the study that you want to use as a database for your research. Now click on “Create basket” and your newly created variable basket appears in the interface.
Now search for the relevant variables on paneldata.org and add them to your individual basket. For example, you are interested in monthly net household income. If you do not know the variable name, you can find the overarching concept using the topic search. Click on “paneldata.org” to get to the main page. Select the study SOEP-Core and click on “topics” at the top of the page.
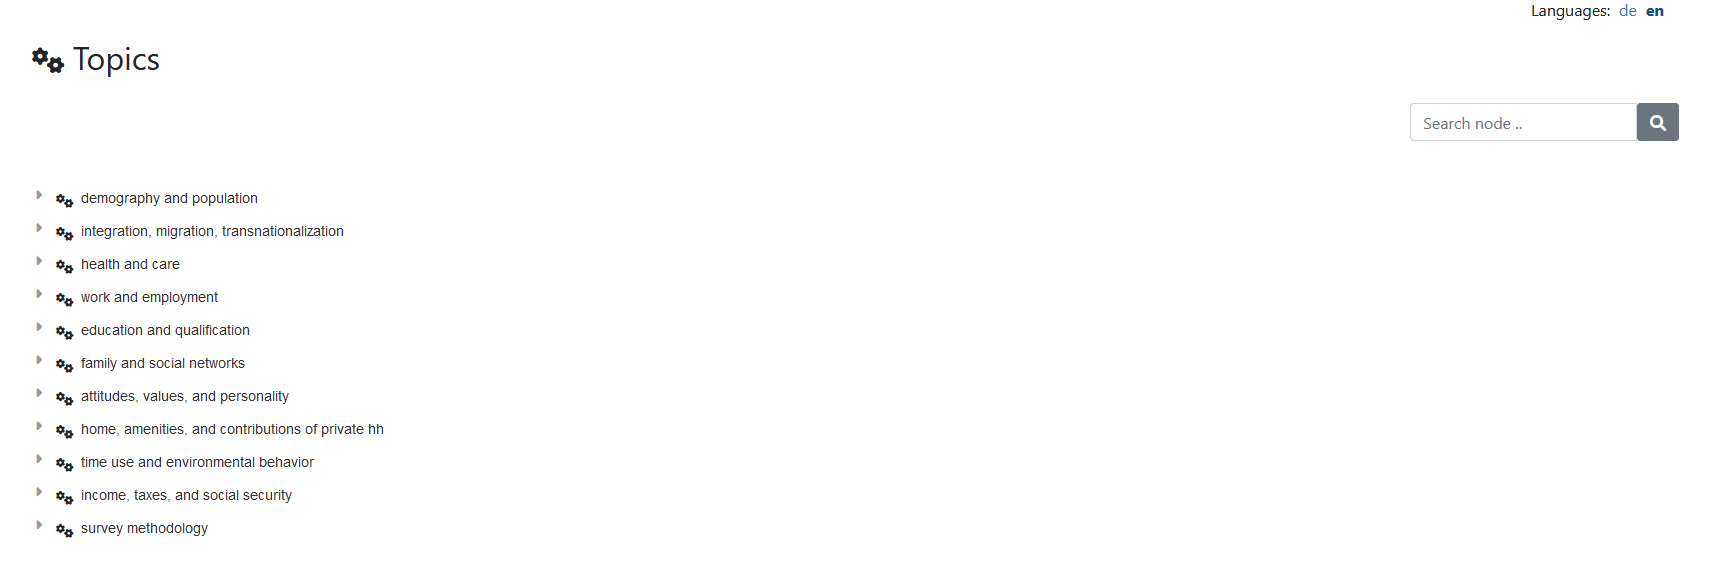
Check the different topics for income-relevant concepts and select “income, taxes, and social security”.
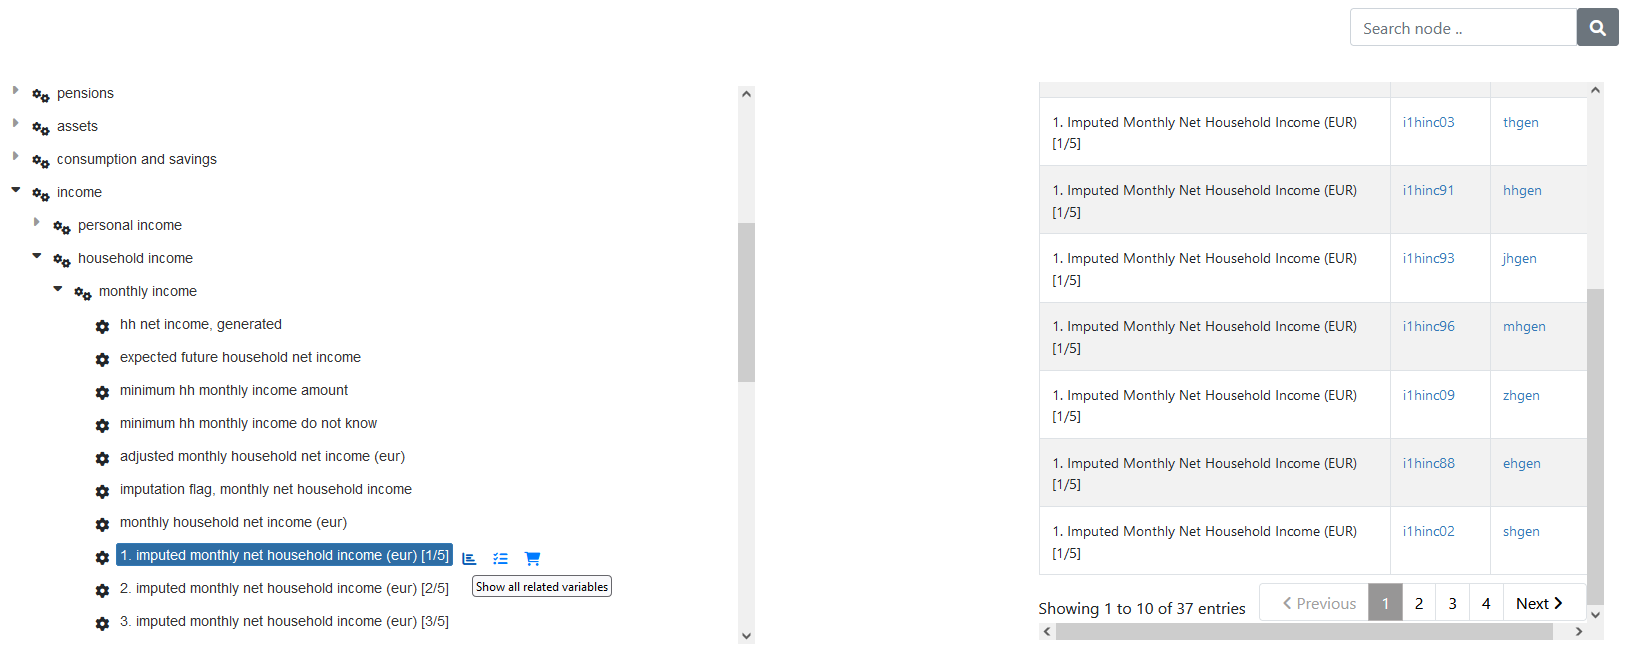
Browse the topic list and you will reach the sub-topic “income” –> “household income” –> “monthly income”. There you will find the variables you are looking for. Click on “show all related variables” and you will see the history of variables on the right hand side of the window.
Select the variable of your desired wave and you will reach the variable overview with important information about the variable.
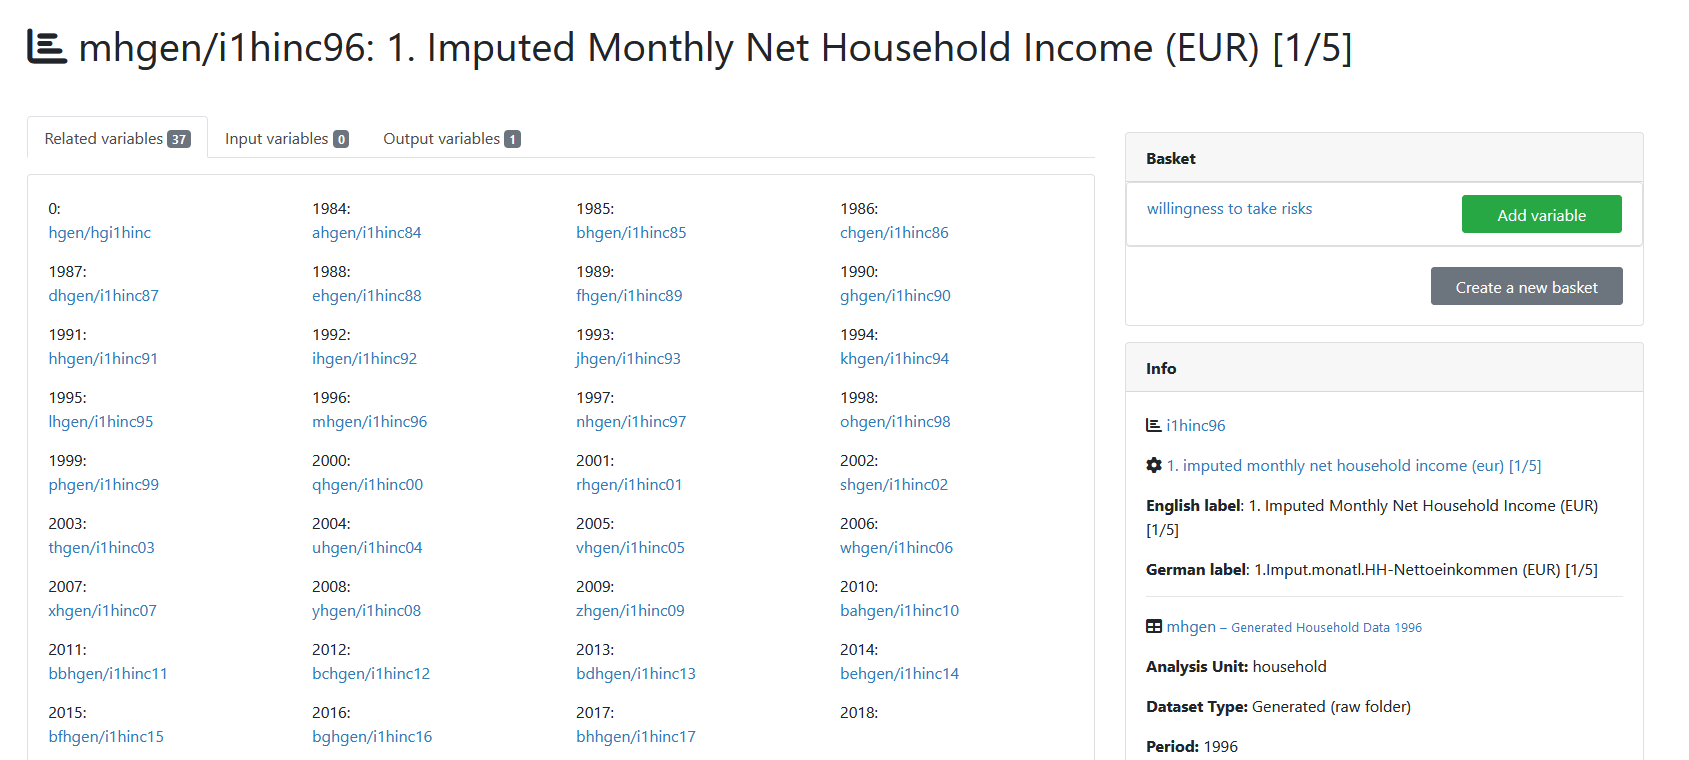
When logged in, the basket area appears in the overview of variables. Your baskets are listed there. If you want to add the variable to a basket, click on “add to basket”. If the variable is already in the basket and you want to remove it, select “remove from basket”. If you want to create a new basket within the overview of variables, click on “create a new basket” and your variable will automatically be placed in the new basket. You can access the basket overview by clicking on the name of your basket in the “basket” section. Alternatively, you can click on the button “my baskets” and you will also return to the basket overview.
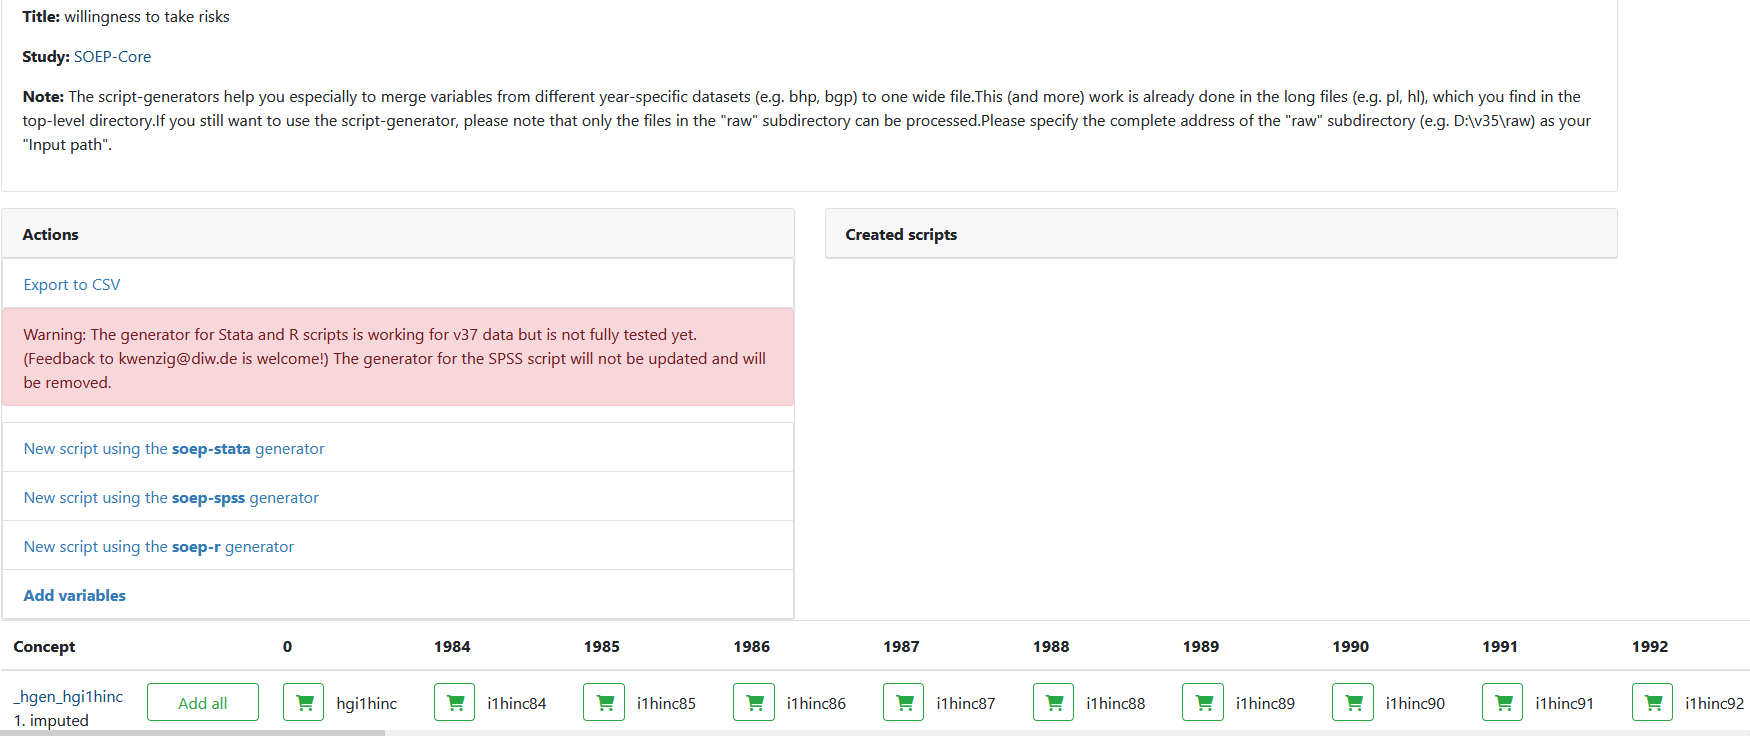
Click on the basket with your added variable and you will get an overview of all variables in your basket. With “add all”, you add the variables of all survey waves and the shopping cart is highlighted in green. If you are interested in a specific survey period, you can select the wave-specific variables by clicking on the shopping cart. Click on “remove all” to remove the variable from your basket. Furthermore, you can export your chosen variables to a CSV-File (Comma Seperated Value-File) and, for example, import them in STATA.
Once you have filled your basket and selected the desired survey waves, you can merge all variables into one dataset. To do this, click on “new script using the soep-xxx generator” in the “actions” area. You can choose between different statistical programs.
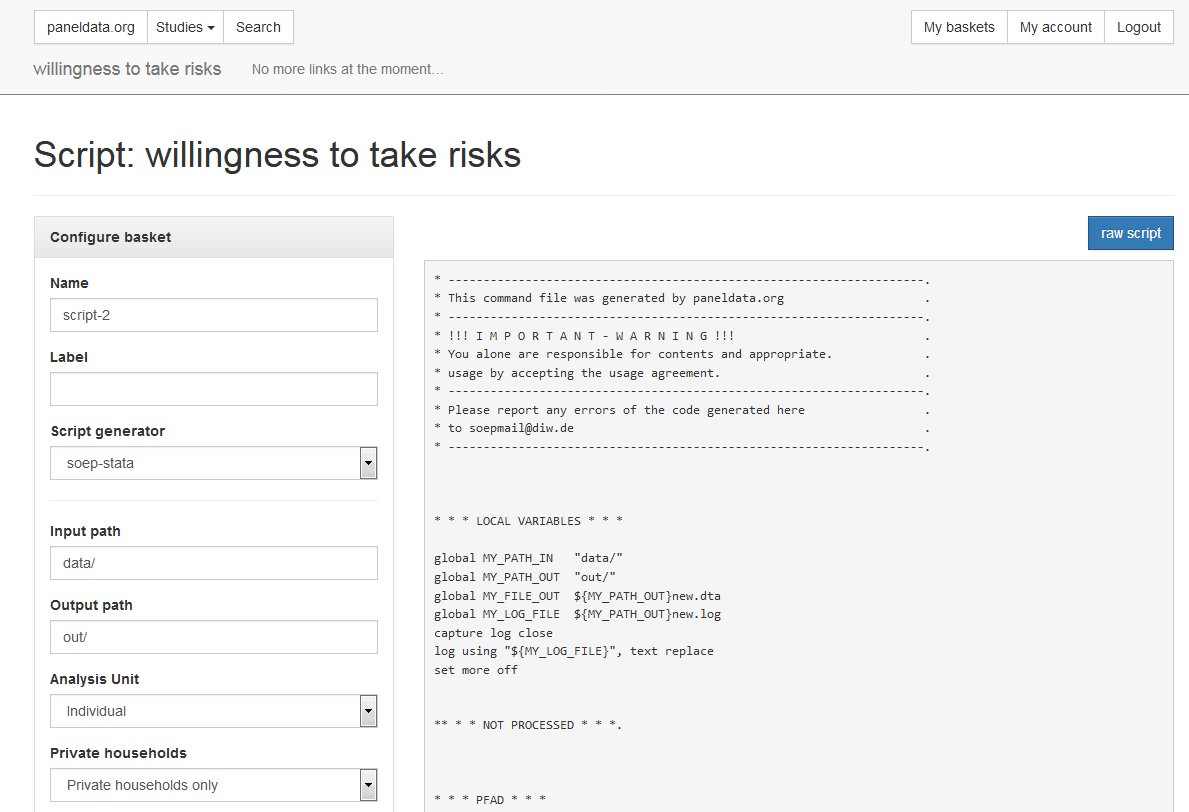
In the script generator, you can create a script that matches your preferred variables. Specify the name of your script, select the statistics program you are using. Enter the (local) addresses of the folders in which the data is to be found or the result (and temporary intermediate results) is to be written in the two path fields (“input” and “output” path).
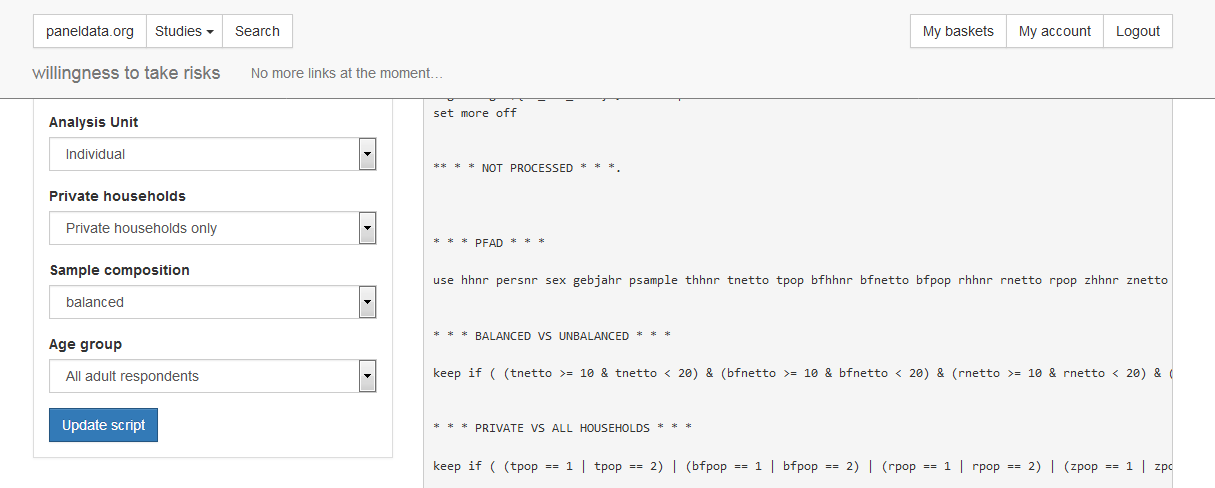
In the “analysis unit” section, you decide whether all persons are considered individually within the household (“individual”) or whether you are interested solely in the household as a whole (“household”). With “sample composition” you can choose between “balanced” and “unbalanced”. If you select “balanced”, you will receive a dataset without missing codes. The respondents provided information on all variables. For more information about balanced and unbalanced datasets, see the section Principles of Data Analysis. Under “age group”, you can limit the respondents. When you are satisfied with your settings, click on “Update Script” and your script will be created.
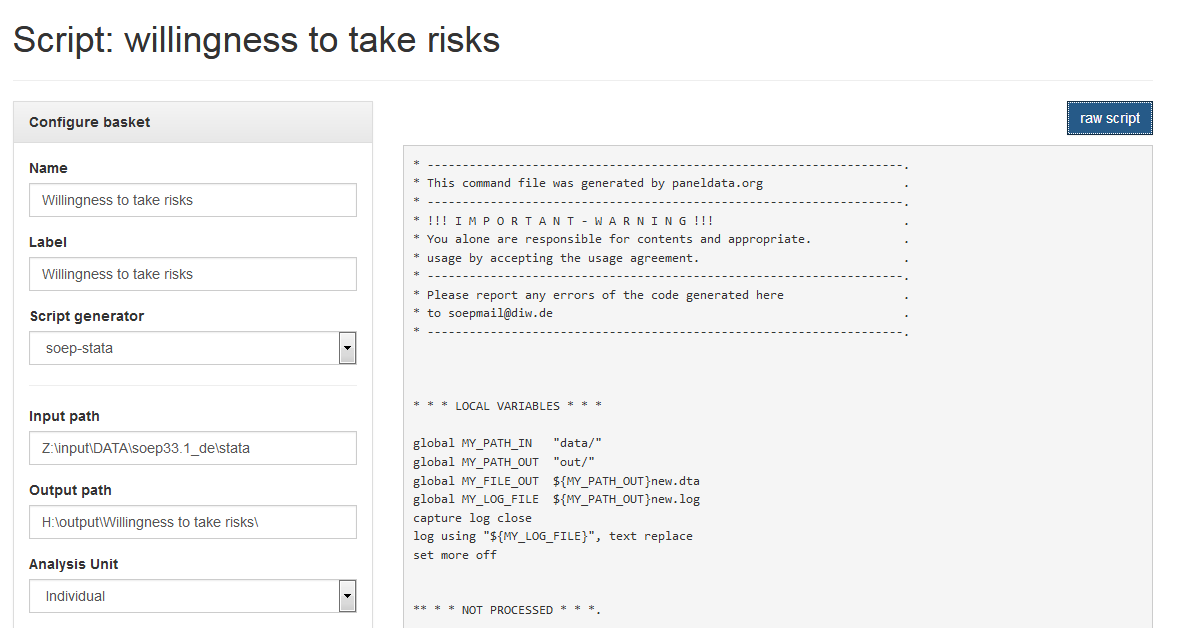
If you click on the “raw script” button, the script is displayed in text form. Copy it to your statistical software. The result dataset has the name new(.dta, .sav). If you want to change it, you have to do it in the script. Execute the script with your statistical software and you will receive your dataset with all your chosen variables.
Last change: Apr 07, 2026