Longitudinal Data Analysis
Simple cross-sectional analyses show that married people have higher life satisfaction than singles. You want to check this on the basis of longitudinal analysis with the SOEP.
Create an exercise path with four subfolders:

Example:
H:/material/exercises/do
H:/material/exercises/output
H:/material/exercises/temp
H:/material/exercises/log
These are used to store your script, log files, datasets, and temporary datasets. Open an empty do-file and define the paths you created with globals:
1***********************************************
2* Set relative paths to the working directory
3***********************************************
4global AVZ 	"H:\Exercise\"
5global MY_IN_PATH "\\hume\rdc-prod\distribution\soep-core\soep.v37\eu\Stata\"
6global MY_DO_FILES "$AVZ\do\"
7global MY_LOG_OUT "$AVZ\log\"
8global MY_OUT_DATA "$AVZ\output\"
9global MY_OUT_TEMP "$AVZ\temp\"
The global “AVZ” defines the main path. The main paths are subdivided using the globals “MY_IN_PATH”, “MY_DO_FILES”, “MY_LOG_OUT”, “MY_OUT_DATA”, “MY_OUT_TEMP”. The global “MY_IN_PATH” contains the path to your ordered data.
Create a master file that uses the important variables from ppathl.
You should always add some variables from PPATHL to your dataset by default. Download the following information from PPATHL:
Individual identifier "pid"
Household identifier "hid"
Survey year "syear"
The net variable with information on the interview type "netto"
The weighting variable "phrf"
The gender of the person "sex"
The migration background "migback"
1*** Step 1) Start with basic information from PPFADL ***
2
3use pid hid syear netto phrf migback sex using ${MY_IN_PATH}\ppathl.dta
Search for matching variables and add them to your dataset
To perform your analysis, you need different SOEP variables. The SOEP offers various options for a variable search:
Search the questionnaires for useful variables. (for more information, see the section Variable Search with Questionnaires)
Find a suitable variable via the topic list of paneldata.org (for more information, see the section Topic Search with paneldata.org)
Search for a suitable variable using a search term in paneldata.org (for more information, see the section Variable Search with paneldata.org)
Use the documentation provided on the generated variables (for more information, see the section Documentation on Generated Data)
In this case, we use the variables "pgfamstd" (martial status) and "plh0182" (life satisfaction).
1*** Step 2) Add the relavant variables: here: family status and life satisfaction ***
2merge 1:1 pid syear using ${MY_IN_PATH}\pgen, keepusing(pgfamstd) keep(1 3) nogen
3
4merge 1:1 pid syear using ${MY_IN_PATH}\pl, keepusing(plh0182) keep(1 3) nogen
5
6save $MY_OUT_DATA\ppathl.dta, replace
Clean and inspect the data
Encode all missing values to system missing. Since you are interested in individual characteristics in your analysis: Delete all measurements that are not based on successful individual interviews.
1mvdecode _all, mv(-8/-1)
2
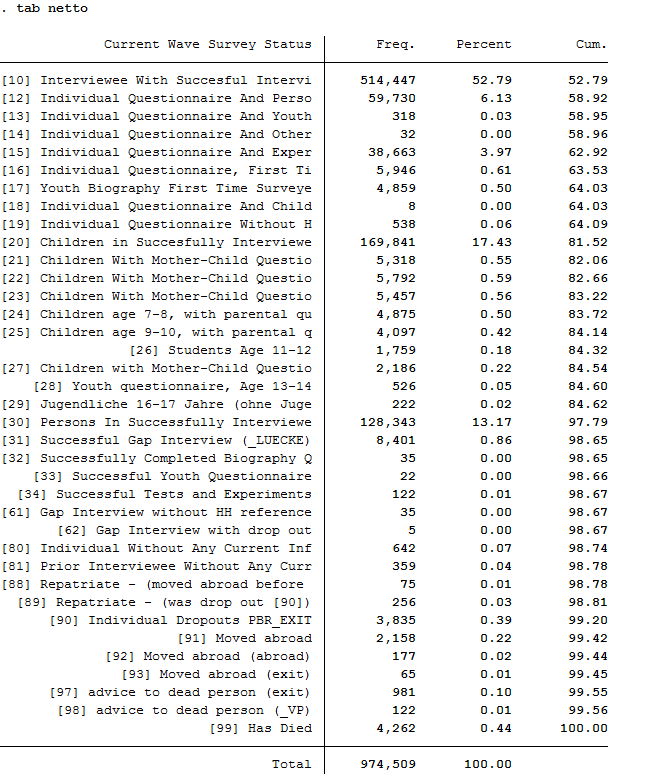
3tab netto
4drop if netto>19
How many people contribute measurements and what is the proportion of people contributing at least 10 waves in a row?
Define the dataset as a panel dataset.
1xtset pid syear
2xtdes
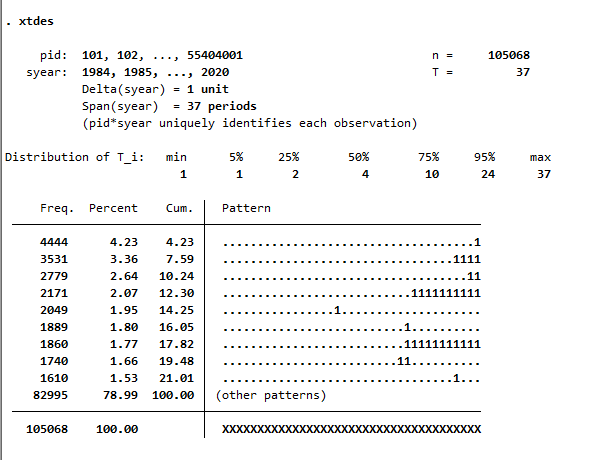
105,068 respondents have contributed information in waves a (1984) to bk (2020) and 75% of the 105,068 respondents have provided information for at least 10 waves.
How many people took part in the survey in 2010 and contributed to continuous measurements up to 2014?
1xtdes if syear>=2010 & syear<=2014
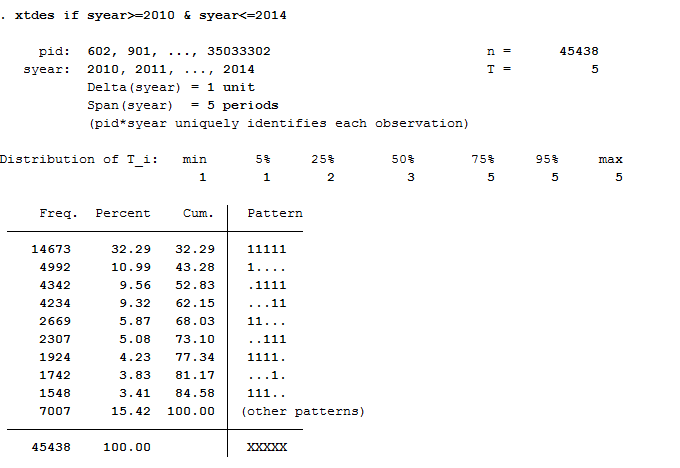
14,673 respondents provided continuous information from 2010 to 2014.
Univariate inspection & analysis
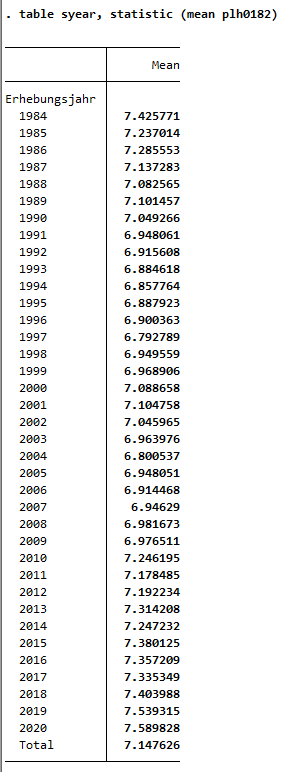
How does the mean of life satisfaction change over time?
1*** Step 4) univariate inspection & analysis
2table syear, statistic (mean plh0182)
What proportion of people are a) married in 2014 or b) have a migration background? Compare weighted with unweighted frequency tables: Who is overrepresented in SOEP?
1tab1 pgfamstd migback if syear==2014
2tab pgfamstd [aw=phrf] if syear==2014
3tab migback [aw=phrf] if syear==2014
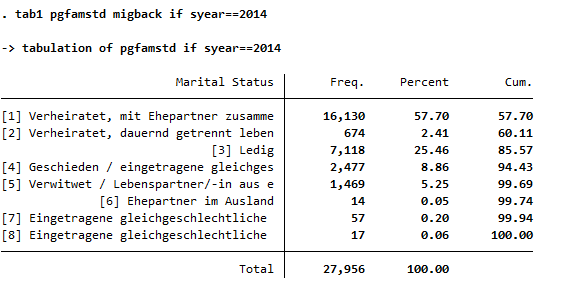
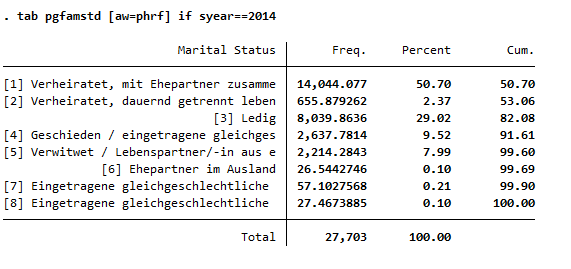
The data show that married people are overrepresented in the SOEP and single people are underrepresented. The weighting makes it representative again for Germany.
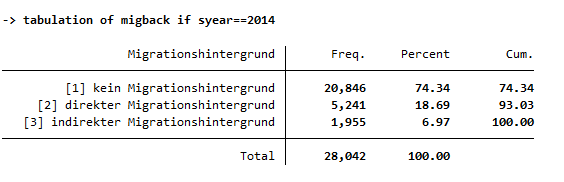

In the SOEP sample, respondents with a direct or indirect migration background are overrepresented.
How many of those persons who reported a life satisfaction scale value of 7 in one survey year also indicated the scale value of 7 in the following survey year?
1xttrans plh0182
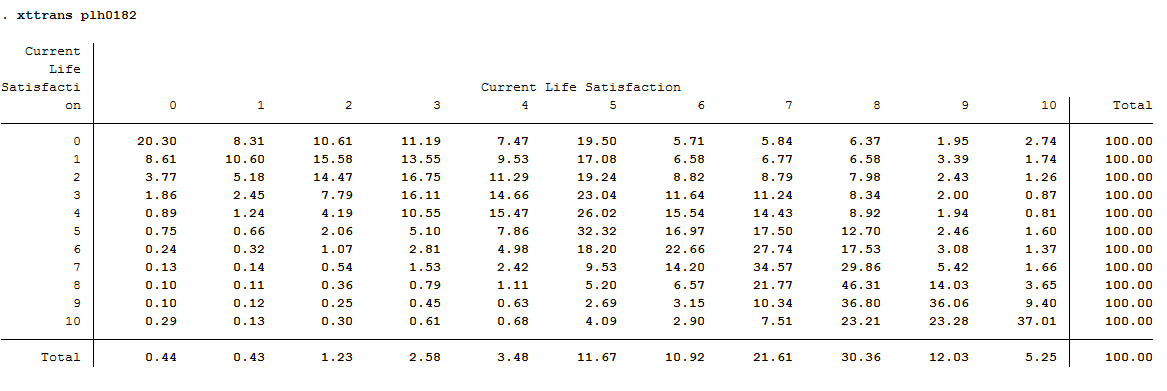
34.57% of the respondents who reported a life satisfaction of 7 again reported a value of 7 in the following year.
Is it more likely that a highly dissatisfied person (value: 0) will be less dissatisfied the following year or that a very satisfied (value: 10) person will be less satisfied the following year?
1xttrans plh0182
The rows reflect the initial values, and the columns reflect the final values. Around 20% of those who were completely dissatisfied (value: 0) in the base year remained completely dissatisfied in the following year. About 80% of these completely dissatisfied people from the base year were more satisfied in the following year. Of the completely satisfied persons (value: 10), about 37% remained just as satisfied in the following year, but 63% became less satisfied. It is more likely that a completely dissatisfied person will become more satisfied in the following year than that a completely satisfied person will become less satisfied.
Which transitions in marital status can be observed particularly frequently in the data?
1xttrans pgfamstd
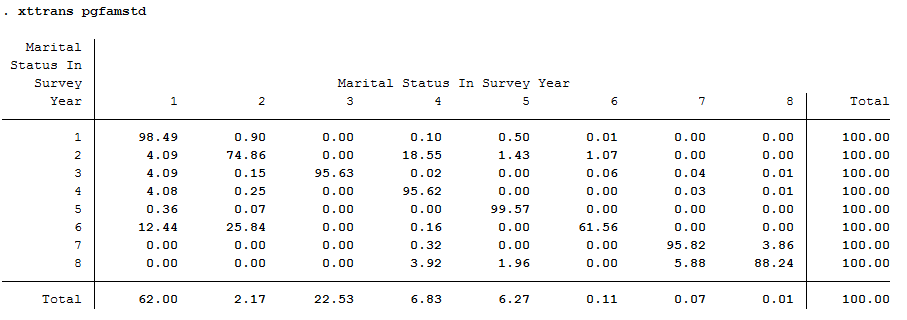
Survey respondents who were married but lived separated [value 2] in the base year and reported divorce as their family status in the following year [value 4] can be observed particularly frequently (about 19%).
Simple cross sectional analyses
You now want to find the correlation between marital status and life satisfaction. Is there an effect of marriage on life satisfaction? And if so, is it a sustained effect?
First, calculate the correlation between family status and life satisfaction from a cross-sectional perspective for 2010: Are married people happier than singles?
1table pgfamstd if syear==2010, statistic (mean plh0182)
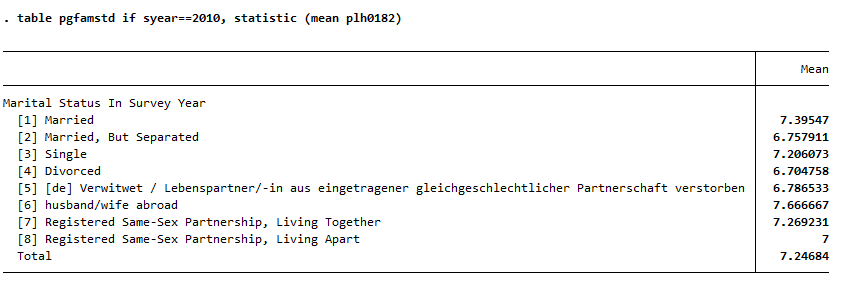
At first glance, married couples seem happier than singles.
Now generate a variable that indicates a transition from “single” to “married”.
How many such transitions can you find in the data?
1**define event: transition to marriage
2generate to_mar=1 if pgfamstd==1 & l.pgfamstd==3
3tab to_mar
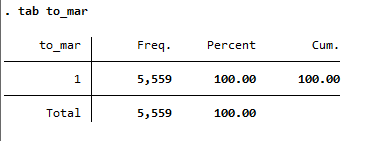
A total of 5,559 people can be observed changing status from single to married.
What is the average level of life satisfaction immediately after the transition to marriage (i.e., in the first survey in which the transition can be observed) and how high is life satisfaction immediately before the transition to marriage?
1**standard way of life-event analysis
2sum plh0182 if to_mar==1
3sum l.plh0182 if to_mar==1
4
5**alternative way
6generate dif_sat= plh0182- l.plh0182
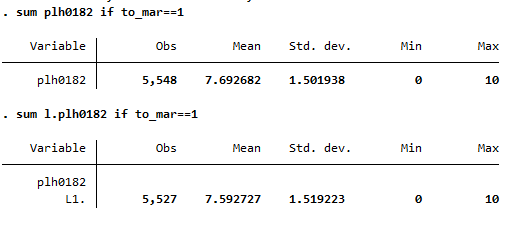
Before the transition to marriage, the average life satisfaction of the respondents is 7.59. In the following year, that is, after the transition to marriage, the average life satisfaction of the respondents is 7.69. It can be seen that with the transition to marriage, average life satisfaction rises slightly by 0.10.
Map the complete satisfaction history around the “marriage entry” event [3 years before; 3 years after].
 1**preparing illustration of trajectory
 2generate t=0 if to_mar==1 & l.to_mar~=1 &l2.to_mar~=1 & l3.to_mar~=1 & l4.to_mar~=1 & l5.to_mar~=1 & l6.to_mar~=1 & l7.to_mar~=1 & l8.to_mar~=1 & l9.to_mar~=1 & l10.to_mar~=1 & l11.to_mar~=1 & l12.to_mar~=1 & l13.to_mar~=1 & l14.to_mar~=1
 3replace t=1 if l.t==0
 4replace t=2 if l2.t==0
 5replace t=3 if l3.t==0
 6replace t=-1 if f.t==0
 7replace t=-2 if f2.t==0
 8replace t=-3 if f3.t==0
 9
10table t, statistic (mean plh0182 n plh0182)
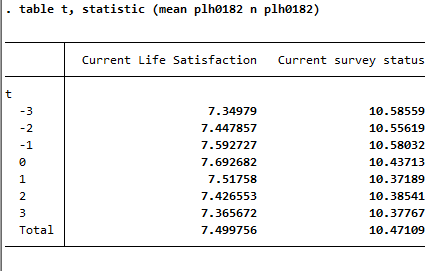
Choose a suitable presentation for your results and let Stata create a graphic.
 1** Preparing graph of event analysis
 2sort t
 3cap drop meanplh0182
 4by t: egen meanplh0182 = mean(plh0182)
 5
 6cap drop upper
 7gen upper = .
 8forval i = -3/3{
 9	su plh0182 if t == `i'
10	replace upper = r(mean) + 1.96 * r(sd)/sqrt(r(N)) if t == `i'
11}
12
13cap drop lower
14gen lower = .
15forval i = -3/3{
16	su plh0182 if t == `i'
17	replace lower = r(mean) - 1.96 * r(sd)/sqrt(r(N)) if t == `i'
18}
19
20twoway (line meanplh0182 t) (rcap upper lower t, lcolor("red")) , title("Satisfaction with life relative to year of marriage") legend(label(1 "Avg. life satisfaction") label(2 "95% Conf. interval")) scheme(s1mono) xtitle("Years relative to marriage") ytitle("Avg. life satisfaction")
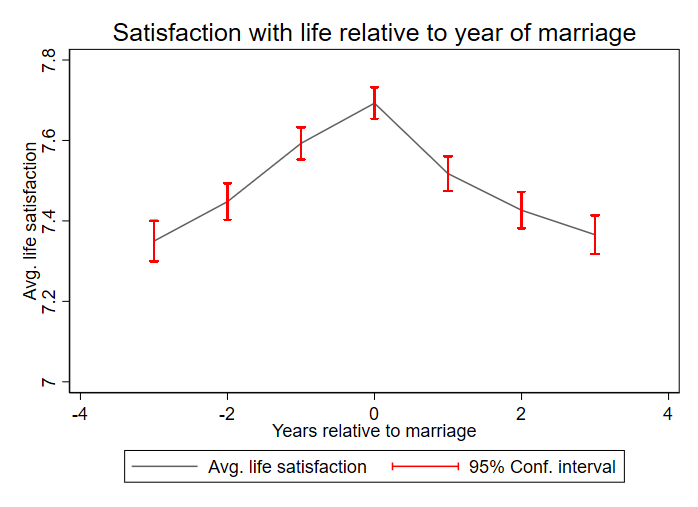
The graph shows that a positive effect on life satisfaction can be observed when family status changes from single to married. In the following years of the existing marriage, life satisfaction decreases again and approaches the initial satisfaction before the marriage.
Last change: Apr 07, 2026