Working with Tracking Data (PPATHL)
For all years since 1984, the PPATHL dataset contains information on all persons who have ever lived in a SOEP household when a survey was conducted (i.e., all adult respondents as well as children under 17 years of age and household members who have never given an interview). PPATHL is important in distinguishing research units (persons), especially for longitudinal analysis.
Time-constant information on individuals:
Never Changing Person ID (pid)
ID Household (hid)
Gender (sex), year of birth (gebjahr), year of death if applicable (todjahr)
Migration Background (migback)
Sample Member (psample)
Year Moved to Germany (immiyear)
Country Born In (corigin)
Time-varying information from individuals:
Survey Year (syear)
Survey Status (netto)
Sample Membership (pop)
Survey Region in 1989 (East or West Germany) (loc1989)
The dataset is explained in more detail in the following documentation:
Create an exercise path with four subfolders:

Example:
H:/material/exercises/do
H:/material/exercises/log
H:/material/exercises/output
H:/material/exercises/temp
These are used to store your script, log files, datasets and temporary datasets. Open an empty do-file and define your paths with globals:
1***********************************************
2* Set relative paths to the working directory
3***********************************************
4global AVZ 	"H:/material/exercises"
5global MY_IN_PATH "//hume/rdc-prod/distribution/soep-core/soep.v37/eu/Stata/"
6global MY_DO_FILES "$AVZ/do/"
7global MY_LOG_OUT "$AVZ/log/"
8global MY_OUT_DATA "$AVZ/output/"
9global MY_OUT_TEMP "$AVZ/temp/"
Attention
Please note that until version 33 (v33), PPATH was called PPFAD. The following exercises are done with version 37 (v37).
The global „AVZ“ defines the main path. The main paths are subdivided using the globals “MY_IN_PATH”, “MY_DO_FILES”, “MY_LOG_OUT”, “MY_OUT_DATA”, “MY_OUT_TEMP”. The global “MY_IN_PATH” contains the path to the data you ordered.
Based on the data in PPATHL, answer the following questions:
1. Look at the two people with the Person IDs (pid) 2102 and 19202
a) What is their gender? When were they born and when (if applicable) did they die?
Open the PPATHL dataset. Search the dataset for variables that describe survey year, sex, year of birth and year of death. Display the information from the variables for individuals 2102 and 19202.
1use "${MY_IN_PATH}ppathl.dta", clear
2list pid syear sex gebjahr todjahr if pid == 2102 | pid == 19202
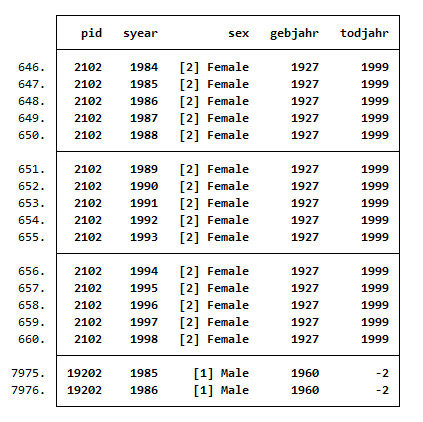
Individual 2102 is female, was born in 1927 and died in 1999. She has participated annually since 1984 until 1998. Individual 19202 is male, was born in 1960 and participated twice, in 1985 and 1986. The value “-2” for the variable year of death (todjahr) stands for “Does not apply”. For more information on the values, see the Missing Conventions.
b) Were these people and their parents born in Germany?
In the dataset, search for a variable that describes the migration background and the survey year. Display the information from the variables for indivIduals 2102 and 19202.
1list pid syear migback if pid == 2102 | pid == 19202
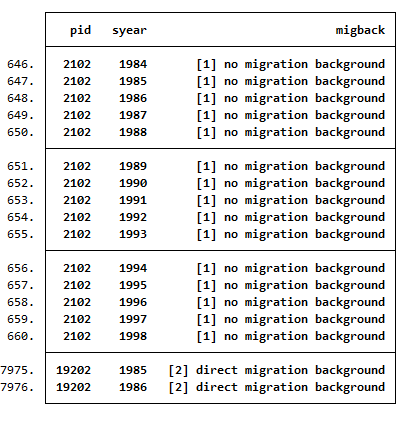
Individual 2102 has no migration background. Individual 19202 has a direct migration background which means that he was not born in Germany.
c) If they immigrated to Germany, in which year and from what country?
Search the dataset for a variable that describes the country of birth, the year of moving to Germany and the survey year. Display the information from the variables on individuals 2102 and 19202.
1list pid syear immiyear corigin if pid == 2102 | pid == 19202
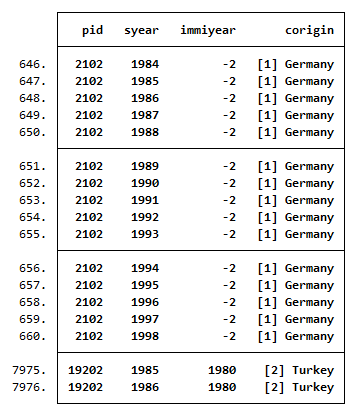
Individual 2102 is born in Germany and has therefore no immigration year. Individual 19202 immigrated from Turkey in 1980.
d) Are these people from East or West Germany?
Search the dataset for a variable that tells whether respondents are from the East or West, the survey year and sample. Display the information from the variables for individuals 2102 and 19202.
1list pid syear loc1989 psample if pid == 2102 | pid == 19202
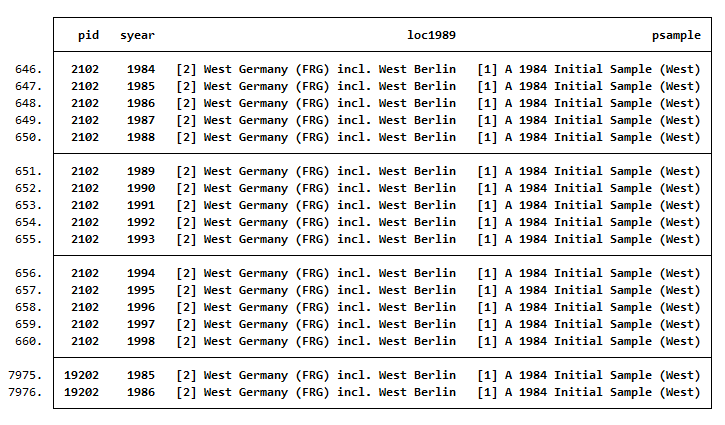
The variable loc1989 shows where the individual lived in 1989. Individuals 2102 and 19202 lived in West Germany in 1989 and, accordingly, were from Sample A (West).
e) What sources provide the information on the migration background and year of death
Search the data set for variables that give you the sources of information for year of death and migration background. The variable miginfo contains the information about the usage of (grand-)parents’ migration history in the SOEP. The variable todinfo gives the source of the information for all persons who have been identified as deceased over the course of SOEP. Display the information from the variables for individuals 2102 and 19202.
1list pid syear miginfo todinfo if pid == 2102 | pid == 19202
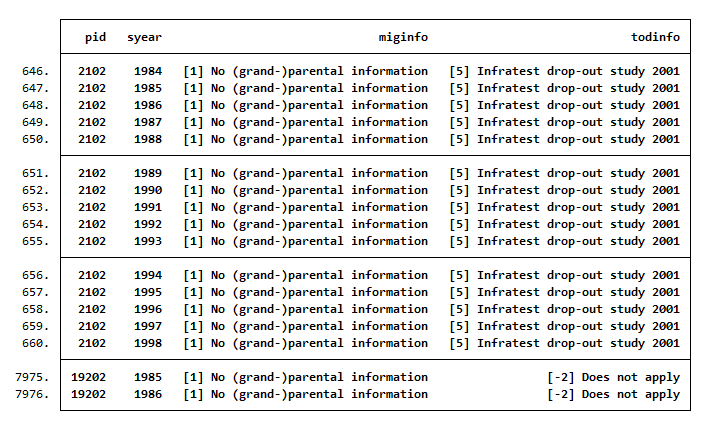
The information on the migration background for both individulas come from the respondents themselves. No further indicators are provided. For individual 2102, the information for the year of death comes from an Infratest Follow-Up Study of drop-outs in 2001. For individual 19202 the year of death is not provided.
2. How many people lived in a private household that was interviewed in 2016 and completed the individual questionnaire?
Search the dataset for variable that describe the population in the 2016 survey year. Display the characteristics of the population variable.
1tab pop if syear==2016
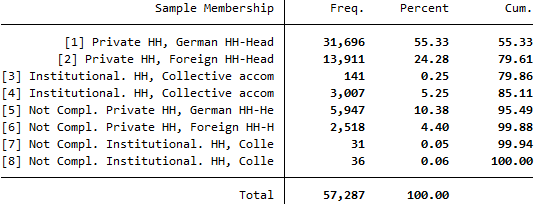
Values 1 and 2 are relevant to answer the question because they describe private households with completed interview.
Search the dataset for variable that describe the survey status in the 2016 survey year. Display the characteristics of the survey status:
1fre netto if syear==2016
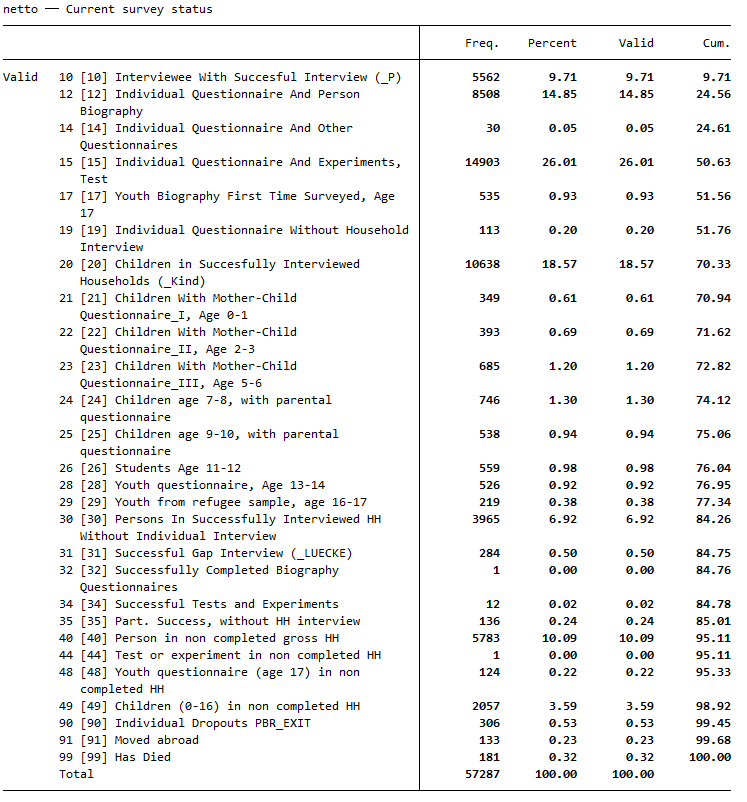
Respondents with survey status between 10 and 15 or survey status 19 completed the individual questionnaire. These are all individuals 18 years and older.
Cross-tabulate the variables netto and pop with an appropriate restricting condition to answer the question.
1tab netto pop if ((netto>=10 & netto<=15) | netto==19) & (pop==1 | pop==2) & (syear==2016)
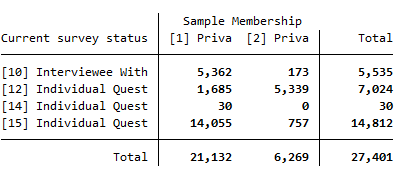
In 2016, a total of 27,401 respondents completed the individual questionnaire for Sample Membership 1 and 2.
3. PPATHL allows you to see which populations can be viewed from a longitudinal perspective:
a) How many people who answered the individual questionnaire in 2000 also took part in the survey in 2014?
Generate a variable and limit the survey status to individuals who answered an individual questionnaire in 2000 and 2014. Note that the values 10,12,13,14,15,16,18,19 of the netto variable mean realized interviews. Sort the dataset by the variable pid and generate a second variable to calculate the sum of the first generated variable. Display the characteristics of the survey status under the condition that the individual questionnaire has been answered.
1gen v1 = 1 if (netto>=10 & netto<=19  & syear==2000) | (netto>=10 & netto<=19  & syear==2014)
2bysort pid : egen v2 = sum(v1) if netto>=10 & netto<=19
3tab netto syear if v2==2 & (syear==2014| syear==2000)
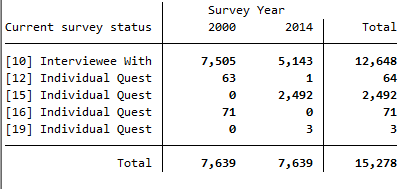
A total of 7,639 respondents completed the individual questionnaire in 2000 and 2014.
b) How many people answered the individual questionnaire every year from 2000 to 2014?
Generate a variable that counts the number of waves of completed individual interviews and limit it to the years 2000 until 2014. If the generated variable takes the value 15, a person has completed a personal interview 15 years in a row. Display the survey status and the survey year with the newly created variable.
1egen h1 = count(syear) if netto>=10 & netto<=19 & syear>=2000 & syear<=2014, by(pid)
2tab netto syear if h1==15 & syear>=2000 & syear<=2014
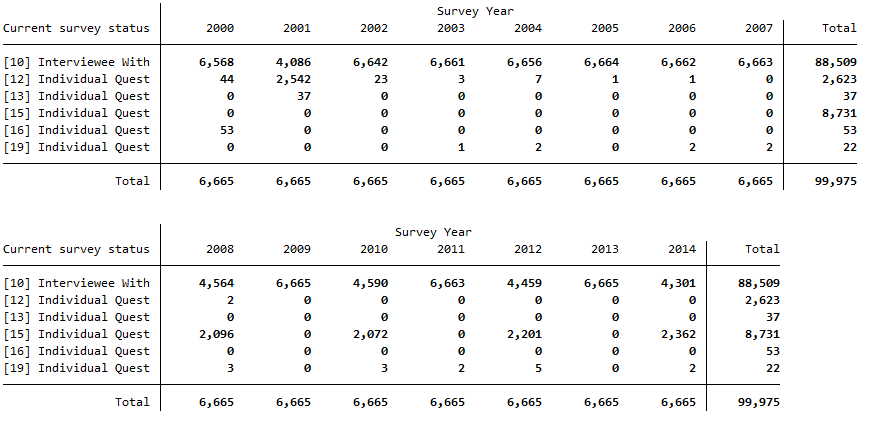
A total of 6,665 people completed the individual questionnaire every year from 2000-2014.
c) How many people who turned 15 in 2011 and spent at least part of their childhood in a SOEP household took part in the survey in 2016?
Generate a variable with people who turned 15 in 2011 and had lived in a survey household as a child. The age of the respondent can be determined with the year of birth, and you can limit children using the net code. Display the new generated variable and the year of birth.
1gen a15kind = 1 if 2011-gebjahr==15 & netto>=20 & netto<30 & syear==2011
2tab a15kind gebjahr
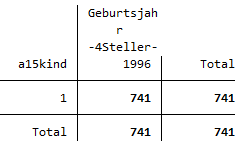
A total of 741 people were 15 years old in 2011 and lived as children in a survey household.
To find out if these 741 people filled out a person questionnaire in 2016, we generate a second variable that fills up the value of one person for all remaining available years. Limit the net code and survey year to narrow down the cases appropriately.
1bysort pid : egen a1 = max(a15kind)
2tab netto if a1==1 & netto>=10 & netto<20 & syear==2016
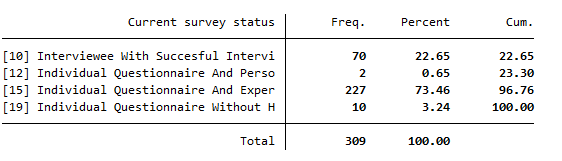
A total of 309 people who were 15 years old at the time of the survey and had been part of a survey household as a child in 2011 completed an individual interview in 2016.
d) The individual with pid=588010 was born in 1984 in a panel household and was still part of the sample in 2009. The individual changed households twice during this time. In which years?
To identify how often and when a individual changed households, you must display all available household numbers in PPATHL for individual 588010.
1list pid hid syear gebjahr if pid==588010
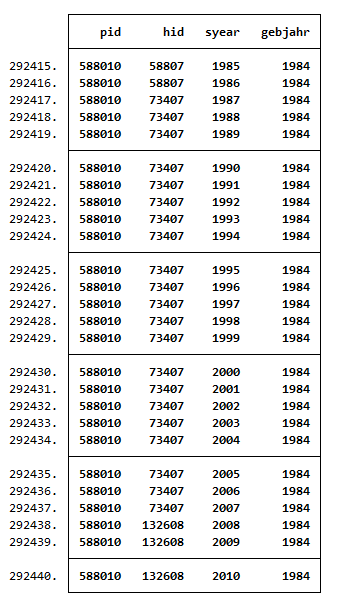
Individual 588010 has participated in the survey since 1985 as part of household 58807. From 1987 to 2007 the individual was in household 73407, from 2008 on, the individual was in household 132608.
Last change: Apr 07, 2026